by Irina Petropavlovskikh, CIRES and NOAA scientist and Christine Smith, NOAA/GML Field Operations Manager
Scientists and engineers at NOAA’s South Pole Observatory collect stratospheric ozone observations there all year round, but they launch ozonesonde instruments most frequently during the ozone depletion period (every September–October) to capture the rapid decline in stratospheric ozone at the South Pole. Ozone has declined there because of human-made ozone-depleting substances, some of which were released in 1960-70s and still remain in the atmosphere due to their long lifetimes.
The annual transport of ozone and chemicals to the Polar region varies from year-to-year, therefore it’s important to know the ozone levels before ozone destruction starts with the rise of the sun. Observing ozone levels during Polar night provides that baseline (or reference), allowing scientists to compare the severity of ozone depletion from year to year.
Here’s some background: Ozone observations at the South Pole began in 1964 with the deployment of the Dobson spectrophotometer. In the 1970s, ozonesonde instruments were launched on weather balloons to track natural variability in ozone levels. In the 1970s and 1980s, these instruments detected the first signs of ozone depletion in the stratosphere over Antarctica resulting from human-made ozone-depleting chemicals. The so-called “ozone hole” became a seasonally observed feature in Antarctica, and NOAA and NASA team up to report on its state annually.
Let’s take a closer look at the Dobson instrument, which measures the gradient in UV sunlight intensity from which the total column ozone is determined. Ozone observations with the Dobson instrument typically start in October, when the Sun is consistently positioned above the horizon. (Every two weeks, scientists at the South Pole also launch ozonesondes, a collection of instruments that measures ozone levels, on large plastic balloons that rise into the stratosphere despite very cold atmospheric conditions.)
The Dobson instrument at the South Pole (and the Brewer from ECCC, Canada) can also observe ozone variability during the polar night (from March-August), when there’s a full moon. So for several days each month, scientists are able to make observations much like they do when the Sun is out.

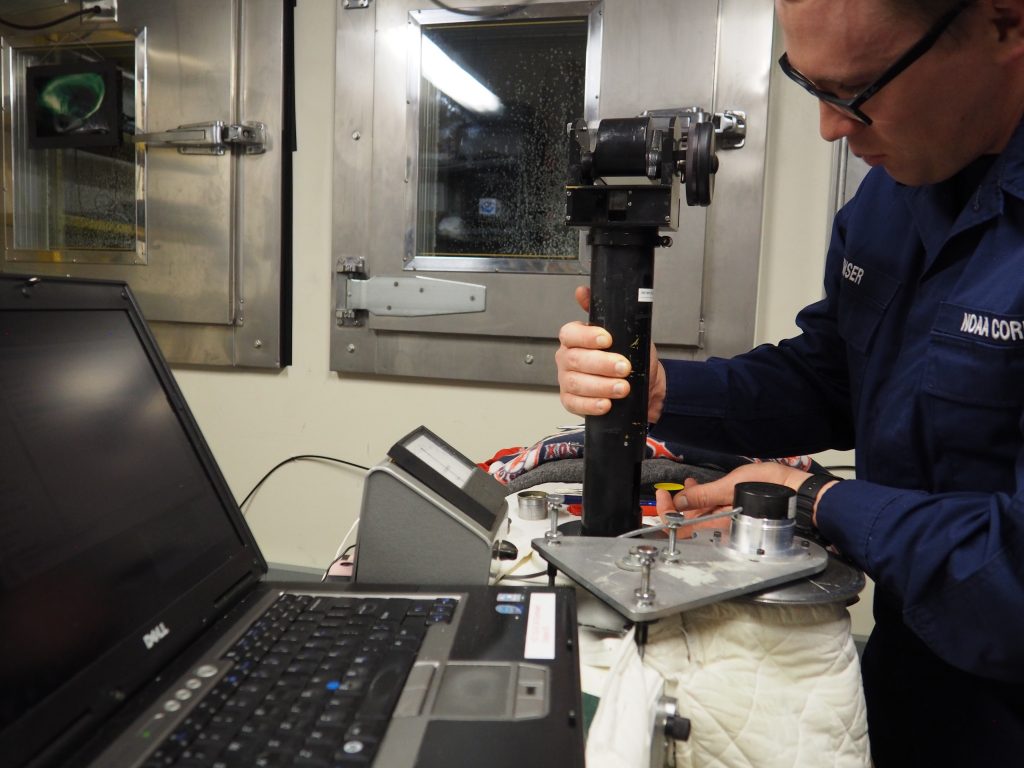
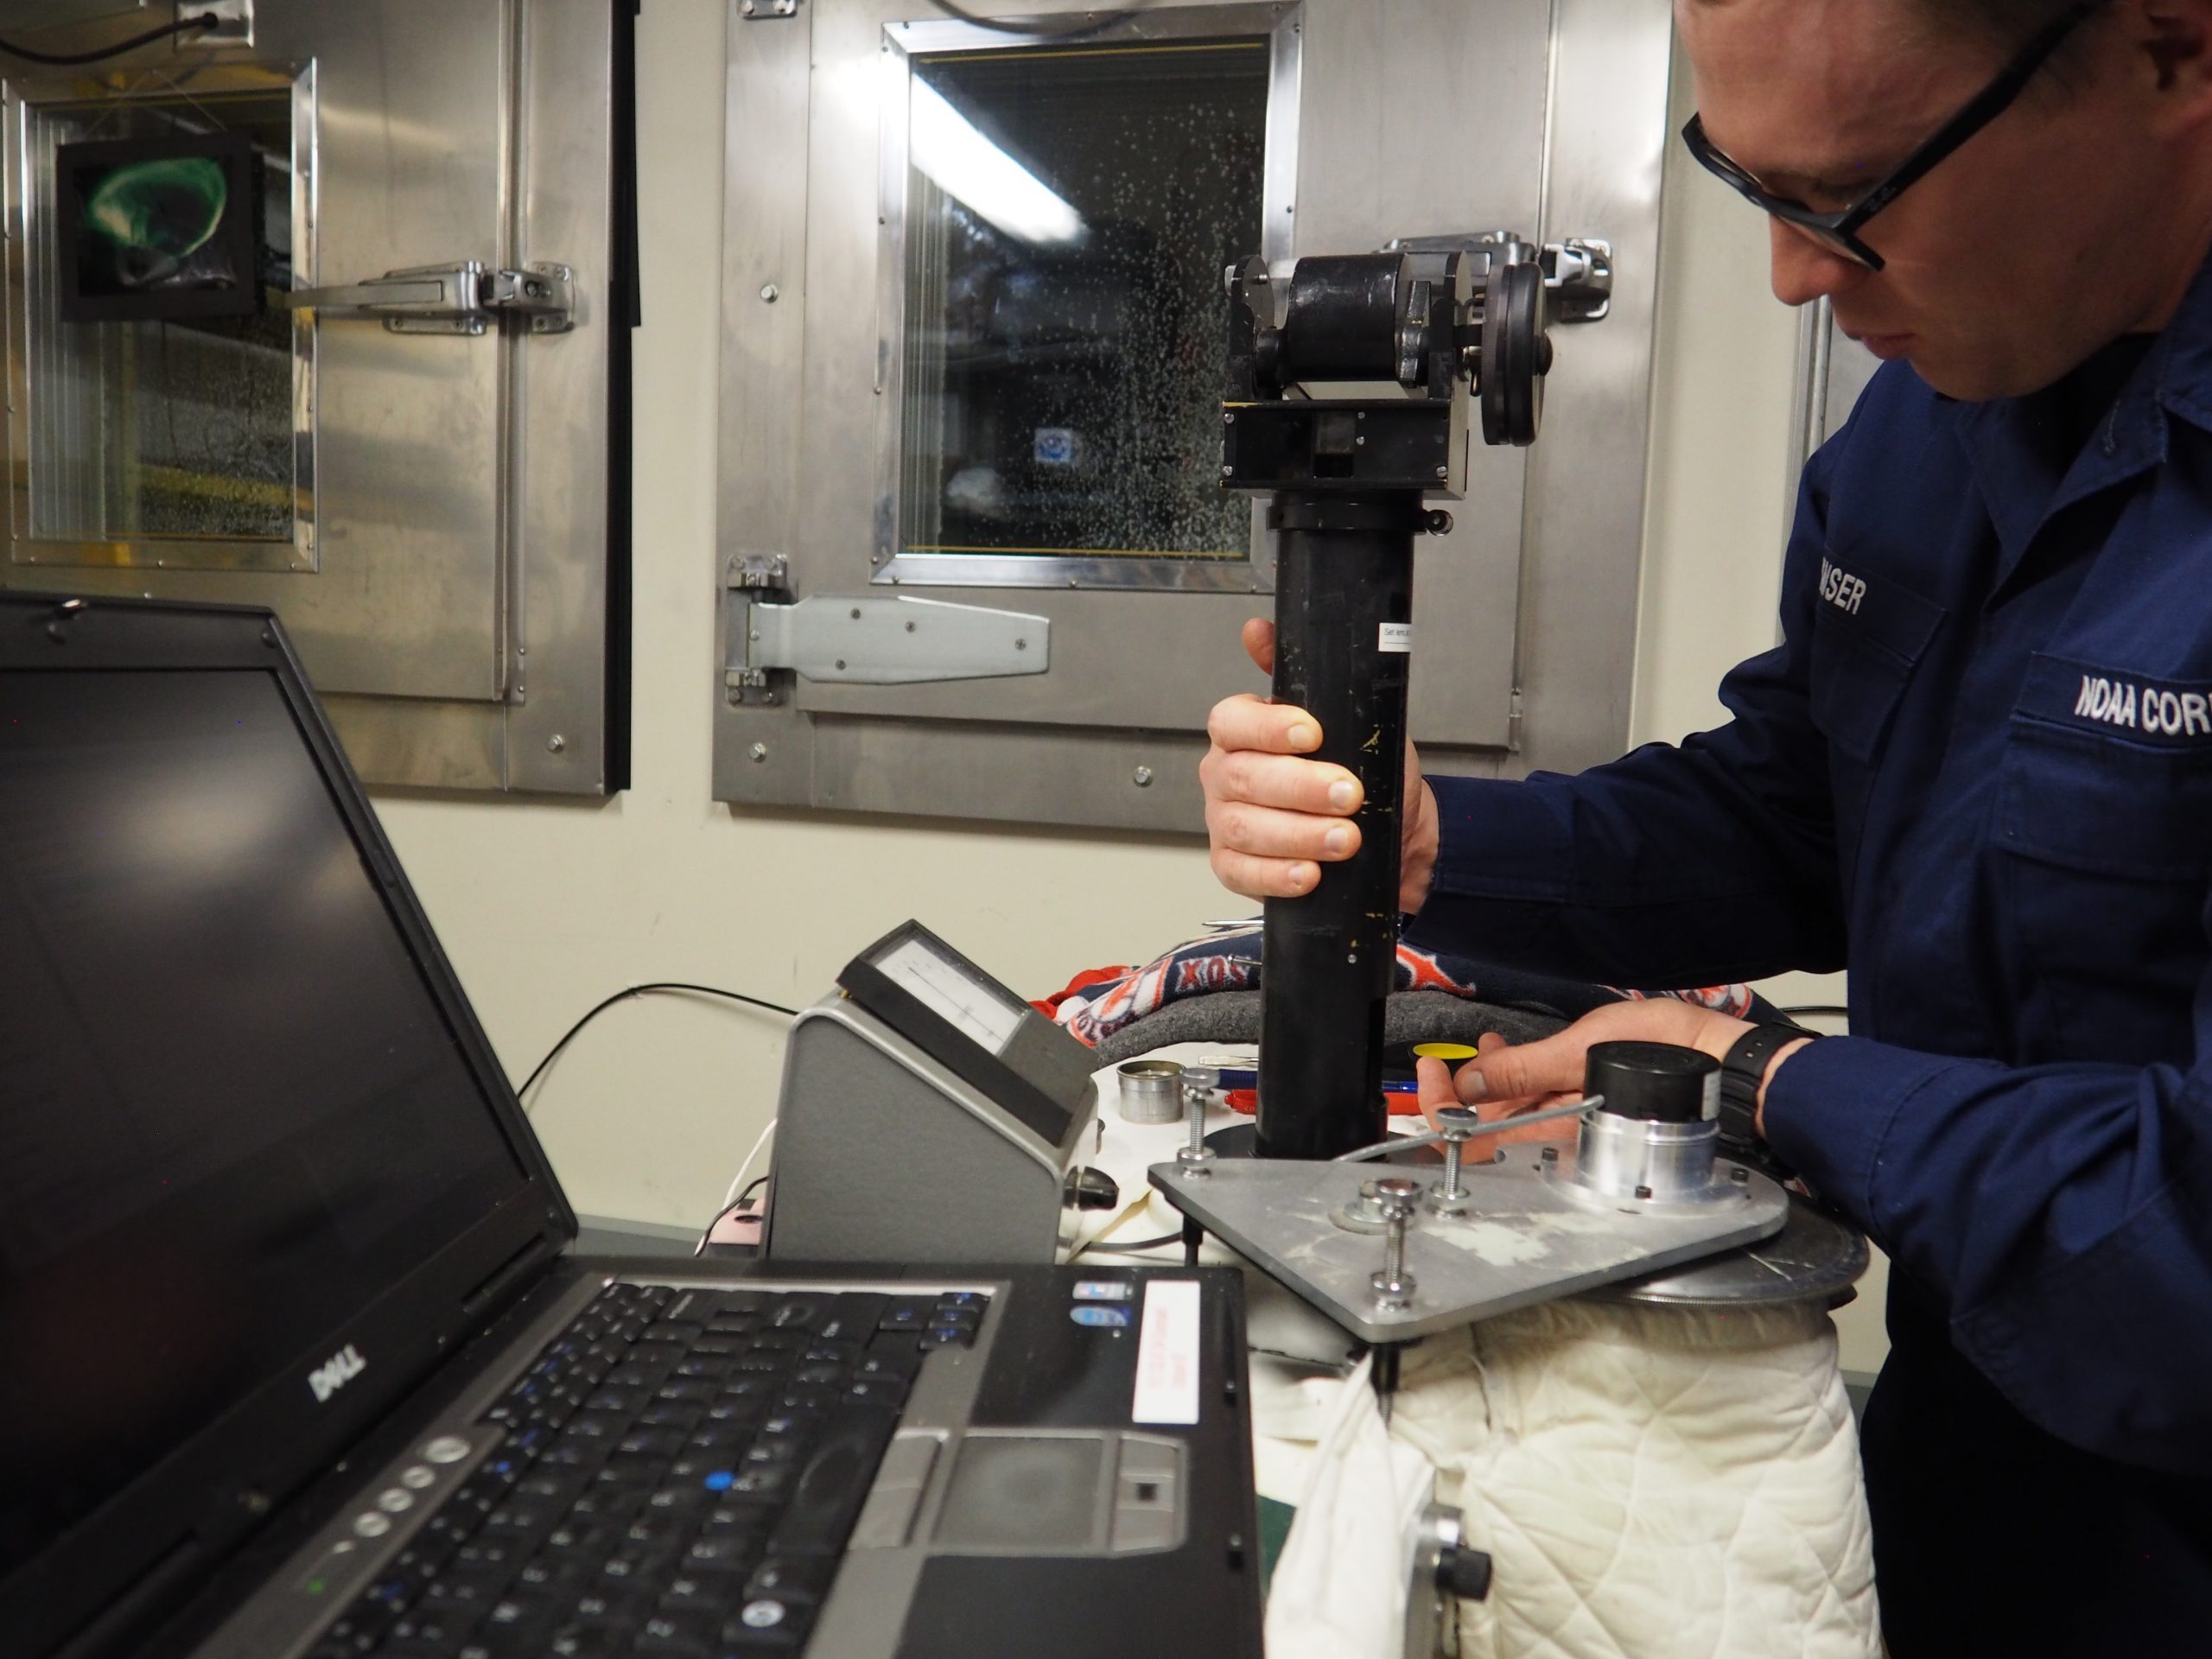
Here’s how they do that: At the South Pole Station, the Dobson instrument is located in a special room with windows and a direct view of the full moon (see the photo above). To record an observation, the operator focuses moonlight through the window and onto the Dobson’s optics through a periscope-like device, continuously rotating the so-called dial (the round disk) until it equalizes the signal at two optical channels inside the instrument. The moonlight is just bright enough to make these observations, and the operator must be able to capture the signal above the observational “noise.” Therefore, researchers “wintering over” at the South Pole Station undergo rigorous training with experts in NOAA’s Global Monitoring Laboratory in Boulder, CO, before deploying to the South Pole. Read more about that training here.

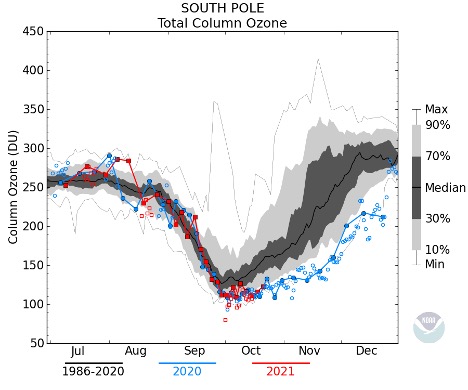
Now, let’s look at some ozone data. Figure 1 shows the time series of total column ozone at the South Pole observed with ozonesonde and Dobson instruments. Total column ozone data from balloon soundings are shown as the larger symbols connected with a line. Dobson ozone data are shown as small size symbols (not connected). The red color designates observations for the current year (for example, this year is 2021), and the blue color (if present) indicates the data for the previous year (i.e. 2020). The lines and shading follow a progression from bottom to top as the minimum (thin black line), the 10th percentile (light gray shading), 30th percentile (dark gray shading), median (thick black line), 70th percentile (dark gray shading), 90th percentile (light gray shading), and the maximum (thin black line) over the period shown in the lower-left corner.
You might notice several open square symbols in July and August—these are the dark months at the South Pole Station. It takes a lot of patience and dedication to perform this type of observation during the coldest months of the year, when temperatures at the ground can be as low as -70 degrees C or -94 F. Read more here.
Learn more about NOAA’s Antarctic ozone research here.

