
By Patrick Cullis, CIRES and NOAA scientist
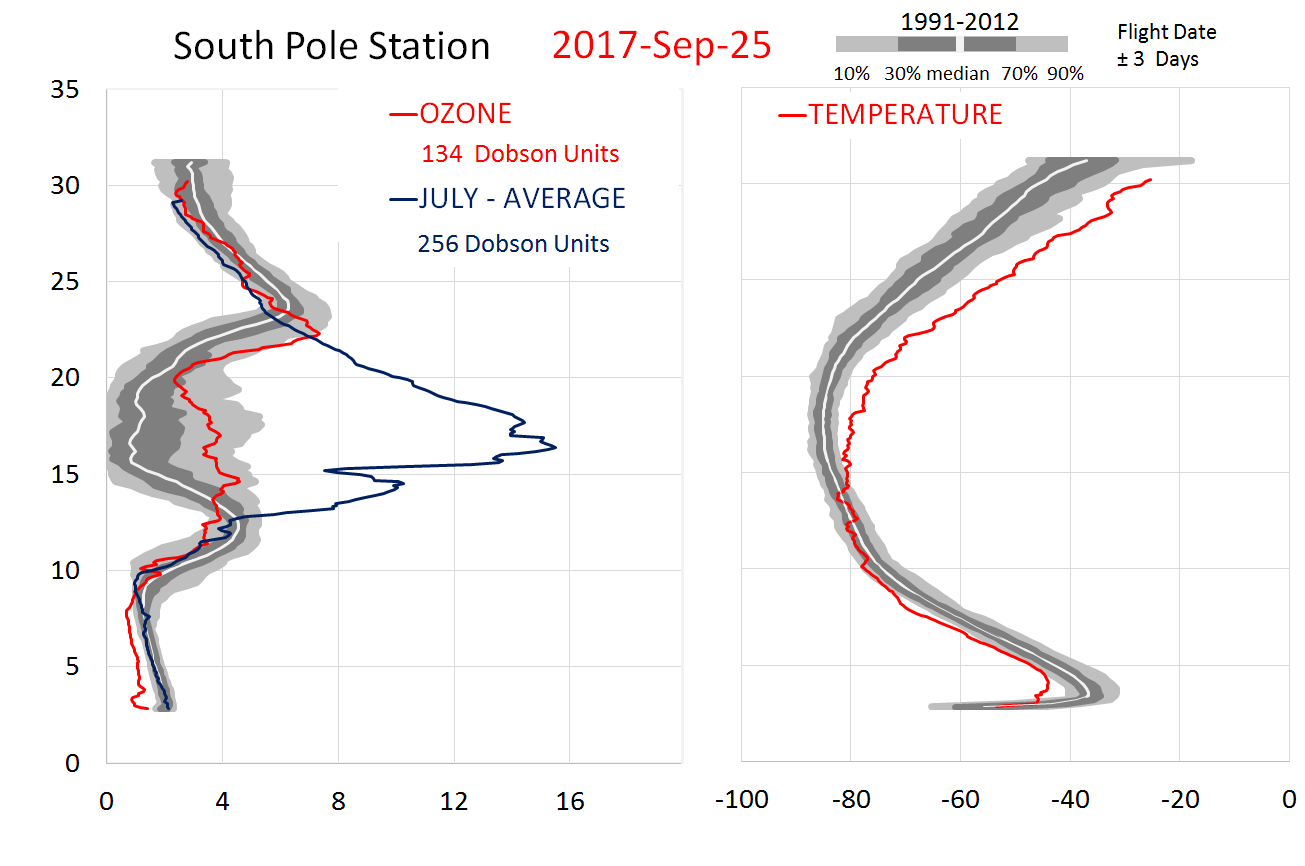
NOAA’s Global Monitoring Division carries out balloon launches to measure the ozone layer and annual development of the Antarctic Ozone Hole from the Amundsen-Scott South Pole Station. This year’s lowest total ozone column measurement of 136 Dobson Units on September 25th was relatively high when compared to the last 32 years.
Ozone holes each year during September and October over Antarctica are expected to be less severe as CFCs continue to decline. Higher ozone in 2017 was also related to an unstable and warmer Antarctic vortex, minimizing polar stratospheric cloud (PSC) formation at high altitudes. PSCs are an important part in the efficient catalytic chlorine destruction process.
- Total Column Ozone reading of 136 DU (9/25/2017) is the 28th lowest in 32 years.
- 14-21 KM Column of 18 DU (10/5/2017) is the 30th lowest in 32 years.
- Early very warm temperatures above 15 km after September 18 – Interesting to see ozone remained low above 24 km with those high temperatures. – We usually see layers of high ozone and warm temperatures later in October.

Historical measurements of the minimum Total Column Ozone reading measured by ozonesondes launched from the South Pole.

Table of historical South Pole ozonesonde Total Column Ozone minimums and 14-21 km ozone column minimums for each year.
Extremely cold temperatures seen throughout the winter in the 14-21 km layer allow the production of Polar Stratospheric Clouds (PSCs) that are critical to the release of destructive chlorine. Beginning in September this year, temperatures became extremely warm when compared to previous years. This resulted in less ozone destruction and higher ozone column measurements.

Column ozone and temperature measurements for the 14-21 km region above the South Pole, Antarctica.

Historical measurements of the minimum 14-21 km Column Ozone reading measured by ozonesondes launched from the South Pole. This region of the stratosphere is where the vast majority of ozone destruction occurs.

Plot of depletion rates for each year’s formation of the Ozone Hole. It is believed that a return to depletion rates above -3 DU/day will be one of the first signs of recovery.