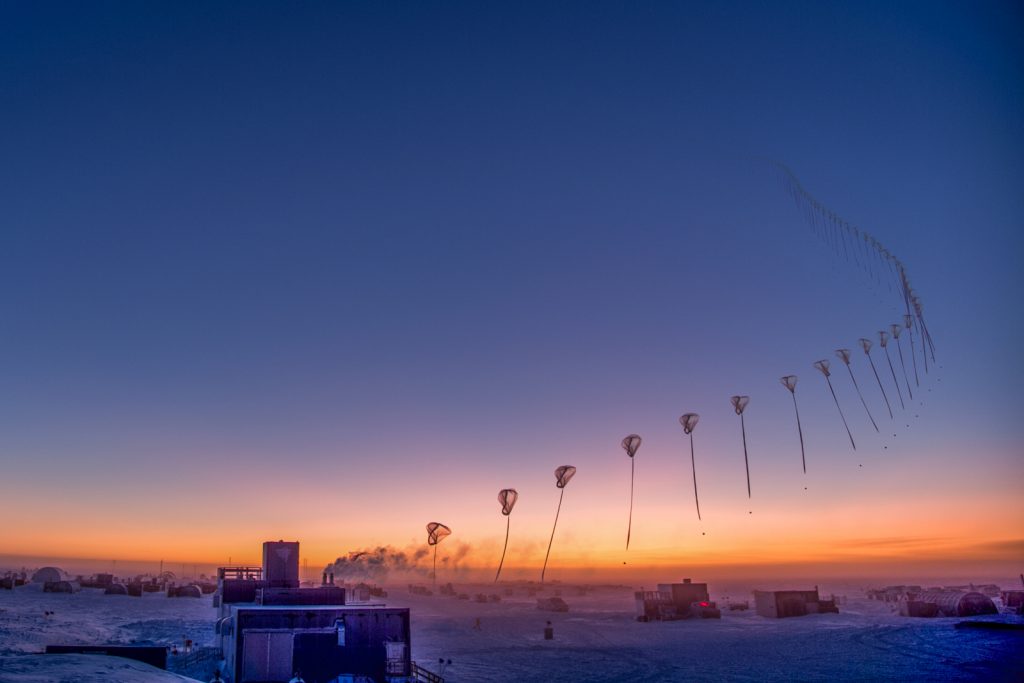
Composite photograph of a dawn balloon launch from the South Pole – Photo Credit: Robert Schwarz
With sunrise behind us and the South Pole beginning six straight months of daytime, destruction of protective ozone continues high above in the stratosphere.
- Oct 03 has a new minimum Total Column Ozone for the year at 115 DU. Tropospheric ozone was much lower compared to Oct 01.
- Oct 01 Total Column was at 125 DU (primarily due to dynamics – there was higher-than-normal ozone in the mid to upper troposphere).
- The 14-21 km Column Ozone layer showed a steep decline during last two weeks of September with a broad 5 km layer of near-zero ozone on Sept 29. Sept 29 also looks like it will be the min for 14-21 km layer for the year as Oct 1 and 3 are higher.
- Overall it looks like the ozone hole is showing improvement (less severe ozone holes and higher minimum values) while stratospheric chlorine has been declining over Antarctica since the peak in 2001 (NOAA Ozone Depletion Index). The South Pole Total Column minimum and 14-21 km minimum are right at the median for the 33 year record during the optimum weather conditions in 2018 for ozone destruction by chlorine (Antarctic polar vortex is cold and stable ).
- Currently launching an ozonesonde every other day. Next profile will come in on Saturday.
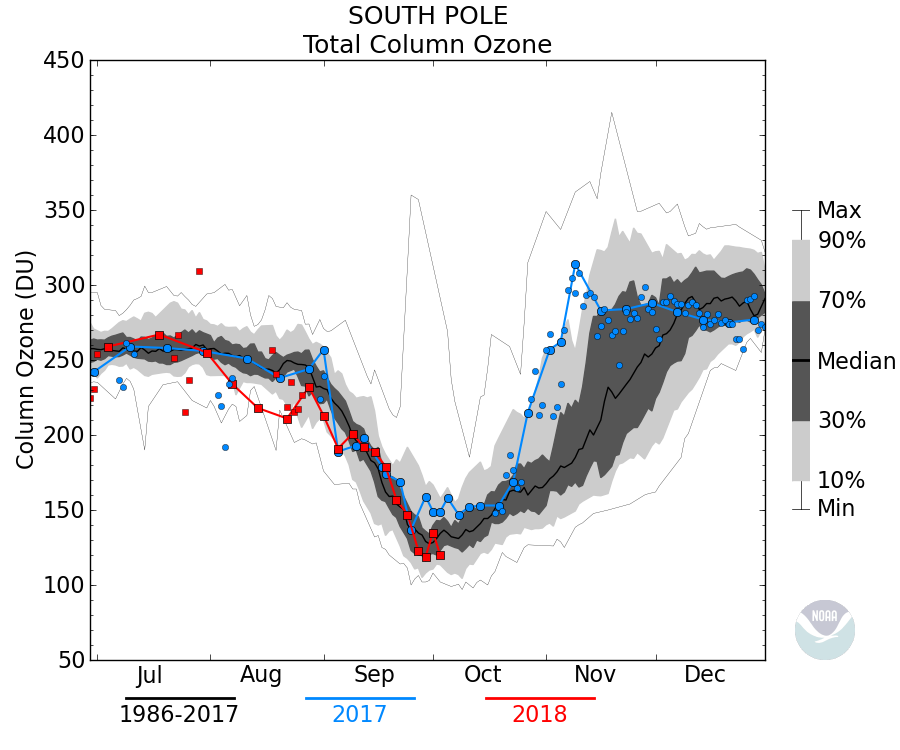
As can be seen in the plot above, 2018 has reached the time period of minimum measurements of total column ozone during the annual formation of the Antarctic Ozone Hole. Scientists at Boulder’s Global Monitoring Division anxiously await each new profile to see how this year will progress. In 2014, an unstable polar vortex allowed relatively warm, higher ozone air in at the beginning of October, while in 2015 the vortex was extremely stable allowing depleted ozone to remain overhead all the way in to December. As we move in to October, how will this year’s appearance of the Antarctic Ozone Hole progress?
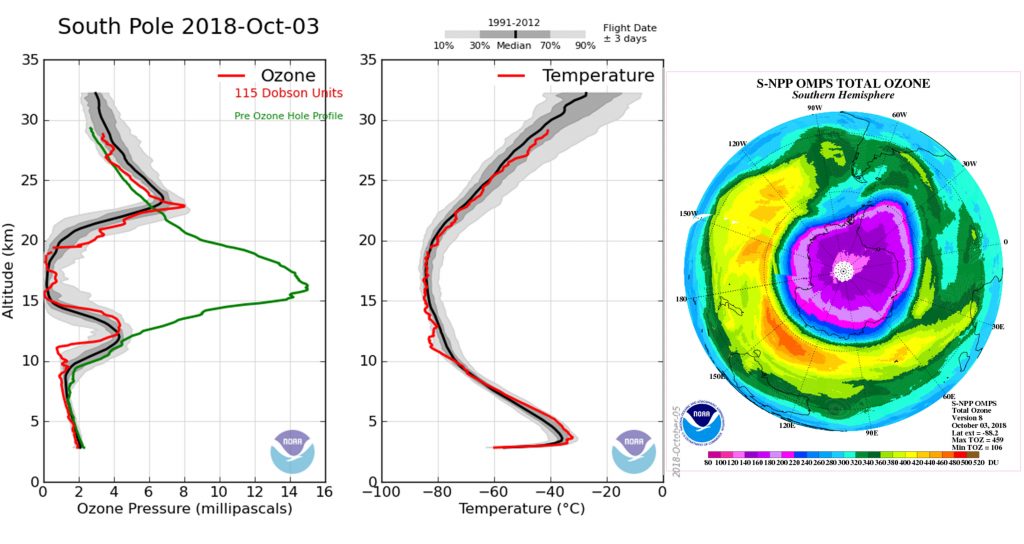
Changing to a vertical representation, we can clearly see where the majority of ozone destruction is occurring. As seen in the left graph, the red line representing the current minimum has plunged toward zero in the 14-20km altitude compared to the July/August average represented in green. The shaded grey areas are the statistical averages since 1991 for this specific date (+/- 3 days) and the profile falls right in line. Stratospheric air temperatures remain cold, as seen in the right graph. If the Antarctic Polar Vortex remains intact, preventing warm, ozone rich air from the mid latitudes mixing in, we should continue to see catalytic ozone destruction above the South Pole well in to October. The satellite image on the right shows the overhead view looking down at Antarctica and the purple, low-ozone area of the polar vortex.