By Patrick Cullis, CIRES and NOAA scientist
The 2021 Antarctic ozone hole is taking shape as we move into the ozone depletion season. Stratospheric temperatures are frigid and the Sun is activating chlorine, beginning a catalytic reaction in which a single chlorine molecule will destroy thousands of ozone molecules, while South Pole ozonesonde measurements show that ozone has begun its plunge down to this year’s minimum.
This year’s ozone hole might be a big one, since atmospheric conditions so far are optimal for depletion. But the currently larger-than-average ozone hole area is well within our expectations. The year-to-year variability in ozone hole size is driven by meteorological conditions in the Southern Hemisphere, which resulted in a fairly small ozone hole in 2002 and 2019.
Overall, though, the ozone hole over Antarctica is on the mend, thanks to the 1987 Montreal Protocol and its amendments. Analyses of the data and model predictions suggest that stratospheric ozone in Antarctica should recover by the 2060s.
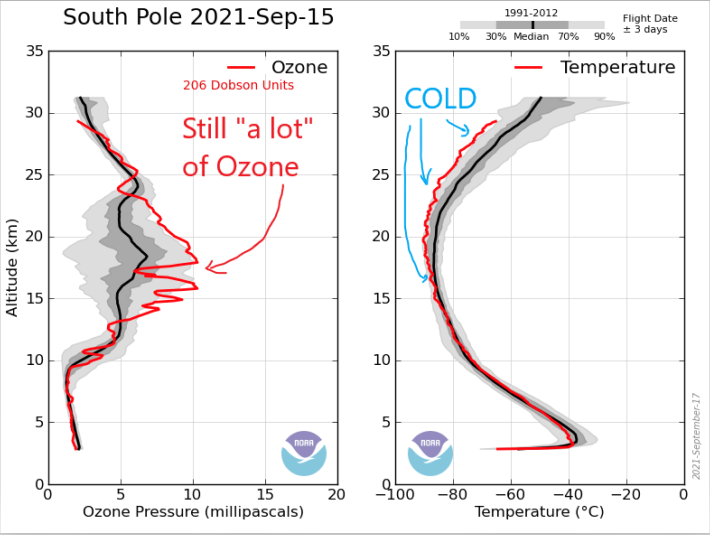
Ozone profiles are measured by balloon-borne electrochemical concentration cell (ECC) ozonesondes. An ozonesonde consists of a small piston pump that bubbles ambient air into a cell containing 3 milliliters of 1% potassium iodide solution. The reaction of ozone and iodide produces a small electrical current in the cell, which is proportional to the amount of ozone. The ozonesonde is also interfaced with a radiosonde, which measures air temperature, pressure, and relative humidity—and transmits all of the data back to a ground receiving station.
We can calculate total column ozone by integrating the ozone partial pressure profile up to the balloon burst altitude and adding a residual amount, based on climatological ozone tables, to account for ozone above the balloon burst altitude. Read more about ozonesondes here.
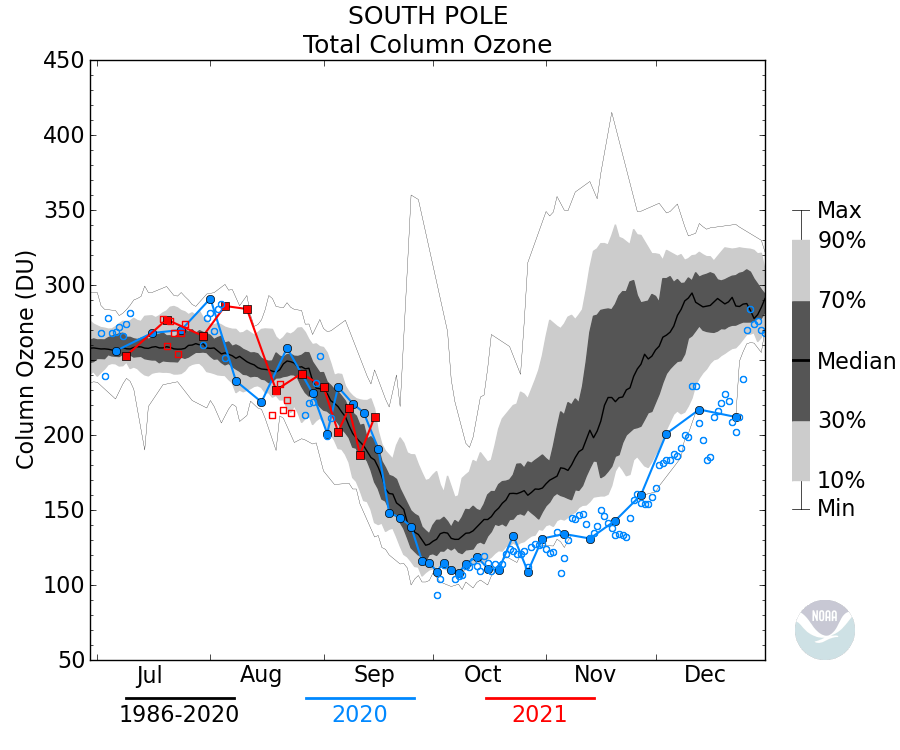
In the figure above, total column ozone data from balloon soundings are shown as the solid dots connected with a line. Dobson ozone data are shown as smaller open dots (not connected) along the ozone-sonde integrated ozone column record. The red line is the data for the current year, and the blue line (if present) is the data for the previous year. Read more about the plot here.

This figure shows temperatures in the 20-24 Km region above the Earth’s surface for years represented in the Total Ozone plot. The red line is the data for the current year and the blue line (if present) is the data for the previous year. Read more about the plot here.