By Irina Petropavovskikh, CIRES and NOAA scientist, from Boulder, September 23
This morning’s e-mail arrived with the first of the World Meteorological Organization’s (WMO) 2016 Antarctic Ozone Bulletins. These bulletins discuss the processes that affect formation of the ozone hole and the status of the ozone layer over the entire Antarctic continent
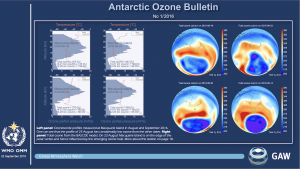
Here’s a short excerpt from the Antarctic Ozone Bulletin no. 1, 2016, courtesy of Dr. Geir O. Braathen, Scientific Officer of the Atmospheric Environment Research Division (AER) Research Department (RES) at the World Meteorological Organization:
“Satellite observations show that the area where total ozone is less than 220 DU (“ozone hole area”) has been significantly above zero since 7 August. This is a relatively early onset of ozone depletion and about ten days earlier than in 2015. The ozone hole area on 20 September was 21.8 millionkm2 , whereas it was 26.1 million km2 on the same date in 2015. The date of the onset of ozone depletion varies considerably from one year to the next, depending on the position of the polar vortex and availability of sunshine after the polar night. In 2016, the vortex has been relatively perturbed and shifted somewhat away from the South Pole. This can explain the relatively early onset of ozone depletion in 2016.
As the sun continues to rise in the sky after the polar night ozone destruction will continue as long as there is active chlorine and bromine present. It is still too early to give a definitive statement about the development of this year’s ozone hole and the degree of ozone loss that will occur. This will, to a large extent, depend on the meteorological conditions. However, the temperature conditions and the extent of polar stratospheric clouds together with the perturbed nature of the vortex so far indicate that the degree of ozone loss in 2016 will be less than that observed in 2015 and probably similar to that observed in 2013 and 2014.
WMO and the scientific community will use ozone observations from the ground, from balloons and from satellites together with meteorological data and modelling results to keep a close eye on the development during the coming weeks and months.”
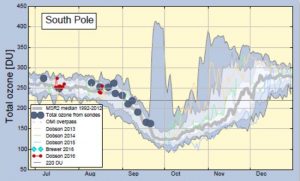
This plot (from the WMO Bulletin, Fig. 29) shows total ozone observations (Dobson instrument – red circles, ozonesonde – blue circles) from South Pole (mid July and to August 2016) plus data from the three previous years and long-term statistics based on the model (MSR-2, NILU). These data show that total ozone so far this season is very near the long-term median.
I would like to share with you the link to the entire first Bulletin, now available on the WMO’s website: http://www.wmo.int/pages/prog/arep/gaw/ozone/index.htm