
By Irina Petropavlovskikh, CIRES and NOAA scientist, from Boulder, September 13
This is the hot time for the NOAA/CIRES ozone team in Boulder and at the South Pole. In Boulder, every day starts with the question, “Any news from South Pole?” We’re all eager to know if the latest sonde launch went well, and if we’re starting to see any signs of the ozone depletion over the South Pole.
From Boulder, Patrick Cullis keeps up with communications on behalf of the team working at the South Pole (Johan Booth and Refael Klein), with details of balloon launches and data analyses. Patrick plots profiles of ozone and temperature and we look at his graph. The graph shows how much ozone was detected at various heights as the balloon (with the instrument attached) traveled high into the stratosphere (to about 100,000 feet), then burst and fell back to the surface.
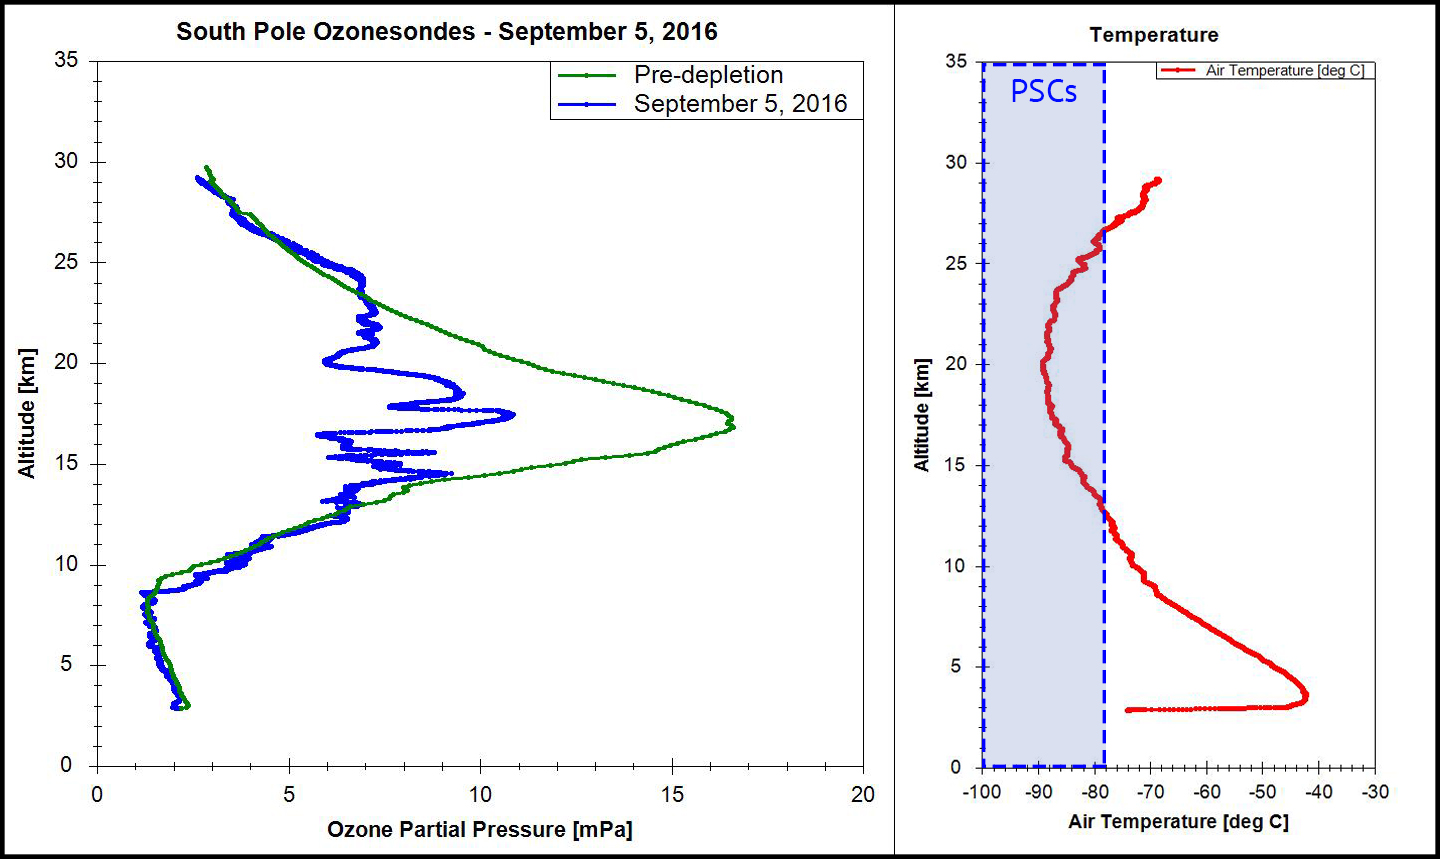
The green line in the left plot represents the pre-depletion ozone levels, while the blue line is the actual reading from a recent balloon flight. Activate chlorine high in the atmosphere has eaten away large chunks of the ozone peak.
The right plot shows the temperature profile along with the blue region where temperatures are cold enough for Polar Stratospheric Cloud (PSC) formation. PSCs form very unique ice crystals with the ability to unlock chlorine from normally stable molecules. Regions with high concentrations of PSCs typically result in higher levels of ozone destruction.
And how do we know if the ozone is already showing signs of depletion over the South Pole? First, we compare those recent profiles to previous balloon profiles from launches in July and August, before the ozone depletion season started. Next, we’ve been launching balloons since the 1980s (and even a few before that), and Bryan Johnson (the project’s PI) has a database that he uses to compare today’s profile to all profiles launched on that day, going back 30 years. This helps us understand how this year looks compared to previous years.
It’s a slow process, but each day the ozone profile looks more and more like someone took a bite out of the nice bell shape of the stratospheric ozone layer. We won’t know how badly ozone was depleted over the South Pole this year until the end of September or the beginning of October. It’s a journey, and we would like to take you with us as we discover what happens with ozone this year.