We’ve talked a lot on this blog about measuring Salt Lake City’s PM2.5 pollution, but you may be wondering: What exactly is PM2.5, and what do we mean when we say we are “measuring” the pollution?
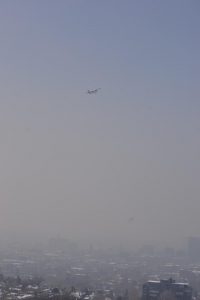
The Twin Otter passing over the University of Utah on one of the city’s worst air pollution day this winter
Let’s start with the observable problem and work backwards to the science: The city is most concerned with its high levels of PM2.5, or small particulate matter, which consists of microscopic particles suspended in air. Unlike the larger PM10 particles which are usually directly emitted, PM2.5 particles tend to be produced chemically and are so small that you could line up about 3000 across the head of a pin. They can therefore easily get into our lungs and cause respiratory irritation and other health issues. They are also a key ingredient in smog. Reducing PM2.5 is a major public health concern, but we can’t remove particles that are already there. The only thing we can do is prevent their formation in the first place.
Scientists already know the basic mechanism of secondary PM2.5 formation: gas-phase molecules are emitted into the air (mostly by human activities), and those molecules react with each other over the course of hours or days, growing larger and larger, until they condense into a particle. Then the particle continues to grow as more molecules get pulled into the particle.
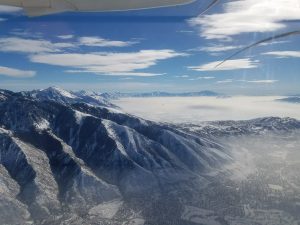
A pollution layer can be seen as the mountain ranges trap pollutants in the valleys
During non-inversion conditions, the gas-phase molecules that are emitted from the surface get transported upward and away by wind, so the reaction times are slow and the PM2.5 levels stay low. But during an inversion, the topology and meteorology of Salt Lake City and the surrounding valleys trap those molecules near the surface, making a concentrated stew of pollutants, which accelerates the particle formation process, leading to high PM2.5 (see right). There’s nothing we can do about meteorology; the only thing we can do is control the emissions. But which ones? It’s not feasible to shut down all human activities during inversions. Also, different industries release different molecules, which form particles at varying rates. We have to make decisions about what emissions make the most sense to regulate, and what will be the most effective at slowing the particle formation.
It’s a complicated question. Particles contains millions of individual molecules, of hundreds of different types, and each type of molecule reacts differently. That’s a lot of chemical complexity. But we can categorize aerosols into broad types describing their most relevant components, and these categories can give us clues about where the particles came from. For example, a particle that contains a lot of ammonium nitrate (NH4NO3) probably came from reactions between gas phase ammonia (which comes primarily from livestock facilities), and nitric acid (which can come from combustion). A particle that has a lot of organic compounds (lots of carbon and oxygen atoms) is likely to have come from urban emissions, such as cars, home heating or biological activity. Aerosols that contain a lot of chlorine may have come from the Great Salt Lake. Our AMS instrument measures all these categories, while our gas phase instruments (NOxCaRD, Iodide CIMS, and the QCL) measure the gas-phase molecules such as ammonia, nitrogen oxides, and acids.
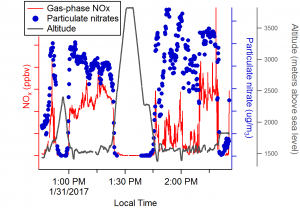
Some sample data. Note that these data are very preliminary and are subject to change as we finalize calibration factors.
So here’s what we mean when we are “measuring the air pollution”: We are trying to get an accurate snapshot of the chemical conditions throughout the valleys during varying times during the inversions. We are looking for point sources of emissions (such as farms and power plants), and the distribution of pollutants from more diffuse sources, such as cars in urban areas. We can see how pollutant levels are different on weekdays (when many people drive) and weekends (when they don’t), and how the levels are affected by the meteorological conditions. We can also measure the height of the pollution layer, by changing altitude and noting where the number of particles suddenly drops off.
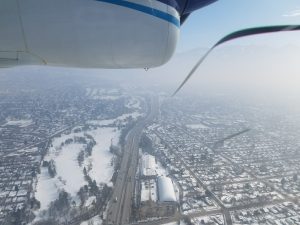
The Twin Otter in the pollution layer
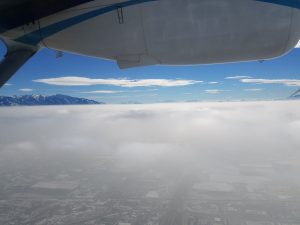
A few hundred feet above the layer.
In the plot above, you can see gas-phase NOx and particulate nitrate, which represent the freshly emitted and chemically oxidized states of nitrogen oxides, during one of our flights. Between 1 and 1:20 pm, we are well within the polluted layer (see picture on the left). At 1:25 we pop out of the layer to cross over into another valley (see picture on the right), and descend back into the layer at 1:45. As you can see, the ratio between gas-phase and particulate phase nitrogen varies depending on where we are, which will give us important information about sources of emissions and how the chemistry is evolving in each place.
The full data set will take a year or more to analyze, but it’s already clear to the scientists that we are measuring some very interesting chemistry.