One thing that the Arctic is known for is stratification. This is when the atmosphere is organized into a number of layers, with little mixing between layers. For example, often the Arctic surface cools very effectively through radiation but the air that blows in overhead is from areas that are warmer, causing a temperature inversion that inhibits vertical mixing of the air over that layer. A similar process can occur near the tops of clouds, supporting similar inversion layers aloft and leading to a sometimes complex vertical structure in the Arctic atmosphere. Mixing across these stratified layers can occur via changes in wind speed with height, via cloud-driven turbulence, and other processes. It is important to understand these processes as they ultimately determine how key constituents are distributed in the atmosphere, such as moisture and aerosols that are needed to form clouds. Our measurements with the tethered balloon system are designed to look at some of these processes. Let’s take a look.
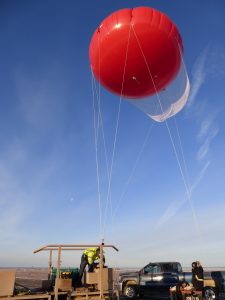
Here is an Aerostat tethered balloon. It can lift a lot of weight and help to get our measurements up through these stratified atmospheric layers.
On 19 October we had the following arrangement of sensors (see picture below). Atmospheric temperature and humidity measurements were made up near the balloon. About 160m below the balloon was a collection of sensors: Atmospheric temperature and humidity, aerosol number concentration, and a sonic anemometer that measures very fast changes in the winds. Also along the whole tether line is a fiber-optic cable that provides a relative measure of temperature over the full depth of our measurements.
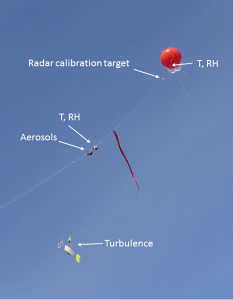
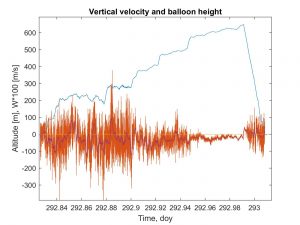
As you can see in the above picture, there were nice blue skies on this day, so we wanted to look at the turbulent mixing in the atmosphere, how that interacted with the atmospheric temperature and moisture structure, and how that determined the vertical distribution of aerosols. We don’t have all of the data together yet, but a little snapshot shows some interesting features. In the image below (in blue), is the altitude of the turbulence measurements, stepping up over time. The red line shows the vertical air motions going past the sensor. The simple interpretation is that when you see more variability in the vertical motions, there is more turbulence in the atmosphere. So on this day, we clearly see stronger mixing when the sensor was below about 300 meters, with a decrease in the layer between 300-500 meters, and then a substantial decrease in the layer above 500 meters. Once we get the rest of the data in order, it will be very interesting to see how turbulent mixing impacts the distribution of aerosols and moisture in the atmosphere…..