25 January 2014
We finished the last of our UAV flights today so now is a good time for me to describe what it is that we’ve been doing for the last two weeks and show you some of the data we’ve collected.
The focus of our research this field season is the lowest part of the atmosphere known as the boundary layer, which in the Antarctic can be up to about 3000 feet deep. This portion of the atmosphere is unique in that it is directly influenced by the underlying surface. What this means is that heat, moisture, and momentum is transferred between the air and the ground. If the ground heats up or cools down the atmosphere above it will respond similarly. This coupling between the atmosphere and the surface is a critical process that ultimately controls all of the weather and climate we experience.
Unlike almost all of the rest the atmosphere the boundary layer is turbulent – what we experience as gustiness of the wind. It turns out that mathematically describing turbulence and its effect on the atmosphere is very difficult and as a result the weather and climate models that we use to forecast the weather typically do not represent this critical part of the atmosphere very well. The overarching goal of this project, and similar ones I’ve done in the past using UAVs, is to make detailed measurements of the boundary layer and how it changes over the course of one to several days so that we can better understand the processes that control the boundary layer. We can then use these observations to evaluate weather and climate model predictions and ultimately improve how they represent this critical part of the atmosphere.
Three years ago, in an effort to better understand the Antarctic boundary layer, the automatic weather station project I work on with the University of Wisconsin installed a 100 foot tall automatic weather station on the Ross Ice Shelf. This tall AWS provides us with continuous observations of the lowest part of the boundary layer and allows us to understand some of the processes I described above.

Tall Tower automatic weather station
Since it wouldn’t be possible for us to build a 3000 foot tall AWS on the Ross Ice Shelf we have turned to using unmanned aerial vehicles (UAVs) to study the full depth of the boundary layer. The UAV we used this year is called a SUMO – Small Unmanned Meteorological Observer. It uses the same airframe you could buy in a model airplane store but has been modified to include a small computer, autopilot, and instruments to measure air temperature, humidity, pressure, and wind.
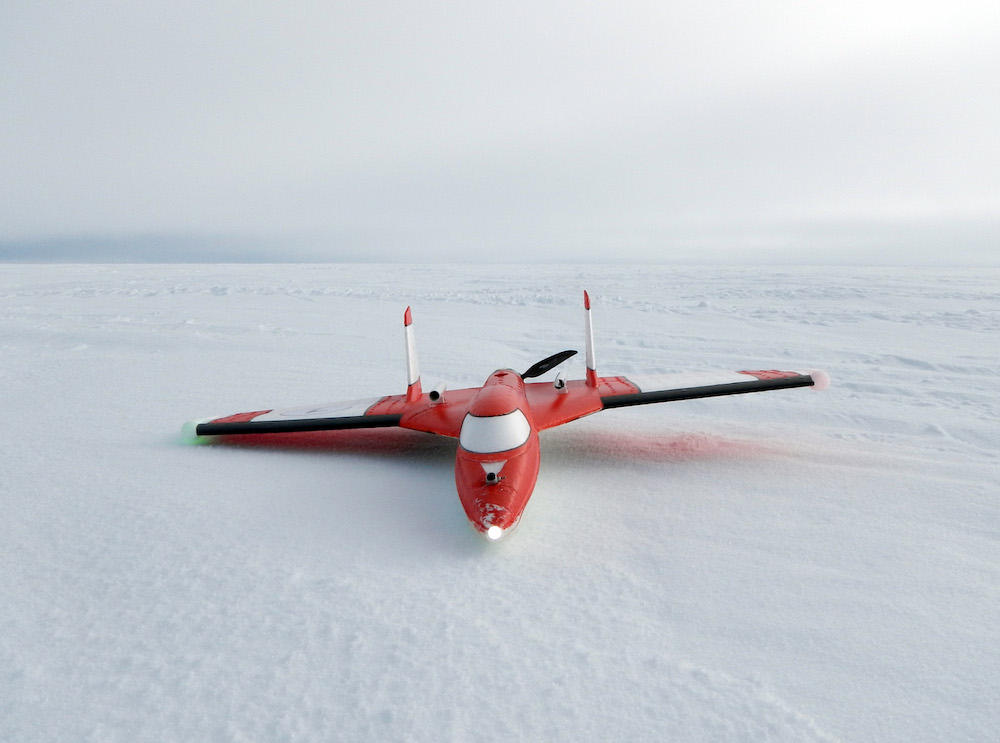
SUMO UAV
The advantage of the SUMO UAV is that it is easy to operate, inexpensive (only a few thousand dollars), and can measure the boundary layer very accurately. It only requires two people to fly a SUMO. One person has a model airplane remote control for manual control of the plane and the other person operates the autopilot on a laptop computer that is in constant communication with the autopilot on the plane by a simple radio link.
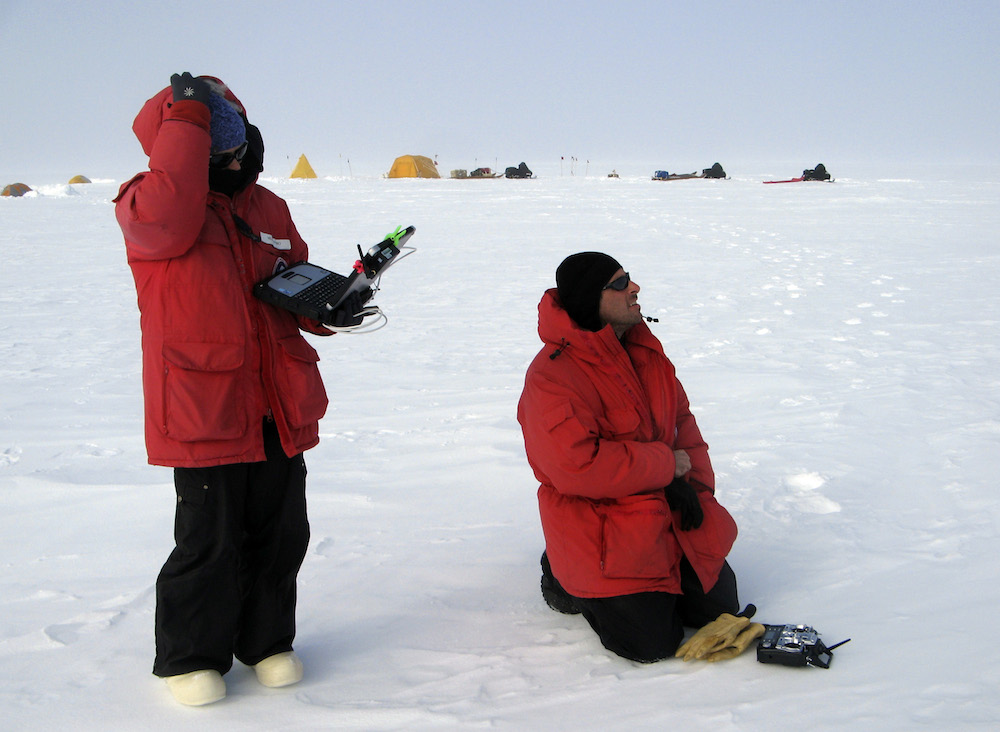
While Melissa watches the SUMO flight on a laptop computer I’m ready to take manual control of the flight if needed using a model plane remote control (photo taken by Suz Detweiler)
The SUMO can do flights up to 30 minutes in duration and in this time it can spiral up to the top and back down to the bottom of the boundary layer providing two profiles of the atmosphere through the entire boundary layer. It is these profiles that are the basis for all of the research we will do.
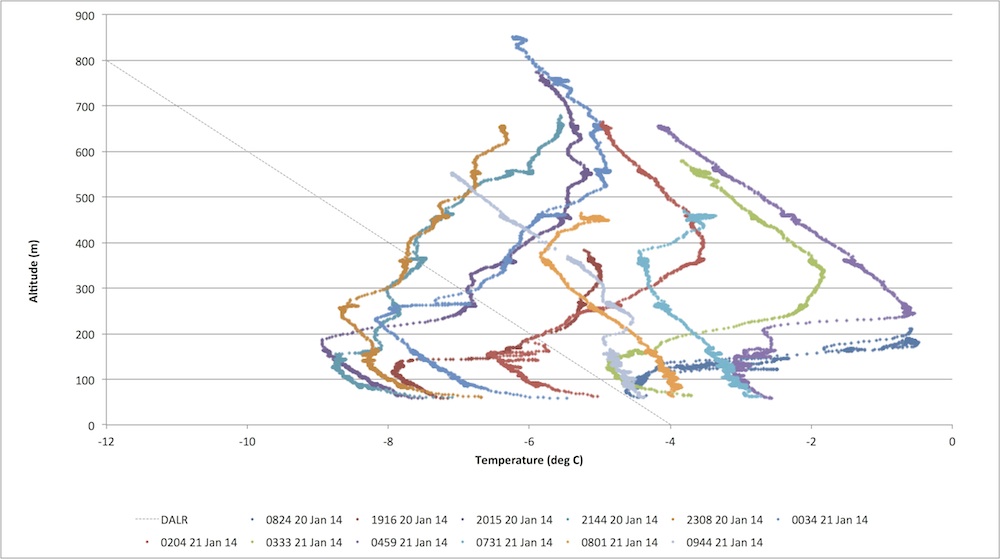
Twelve temperature profiles measured by the SUMO UAV on 21 January 2014.
In the graph above I have plotted all of the profiles we collected during one day of flying at our field camp. These plots show how the temperature varies as you move up through the boundary layer. By looking at the different profiles (different colored lines) you can see how the temperature and the shape of the temperature profile changes dramatically over the course of just a single day.
You can find a video of the changing boundary layer profiles for this day here that makes it easier to see the evolution of the boundary layer over this single day.
From these changes we can determine how much heat is being put into or taken out of the boundary layer and infer other processes that are controlling the boundary layer. We can also compare these profiles against forecasts from the weather prediction model used by weather forecasters in the Antarctic to see if the model is able to reproduce the behavior that we see and identify any deficiencies in the model.
Over the next several months Melissa and I will combine this UAV data with weather measurements from the Tall Tower AWS and the two Snow Web AWS that Ben deployed for us to develop a complete picture of how and why the boundary layer evolved during our field campaign. We will publish our findings in scientific journals and will also place all of the data that we have collected in a scientific data archive so that other scientists (or the public) can access this data and conduct their own analysis on it.
To put our field campaign in perspective I’ll give you a few statistics. Of the 14 days we spent away from McMurdo two days were spent snowmobiling to and from the field camp. We spent two more days installing and removing the Snow Web AWS and setting up and taking down our camp. We also did some maintenance on the Tall Tower AWS during this time. This left us with nine days to do SUMO flights. We were able to fly the SUMOs on six of these days. Over these six days we flew a total of 41 flights – all of which collected useful scientific data. For comparison, in my two previous UAV field campaigns in the Antarctic we flew a total of 30 flights (about half of which collected useful scientific data and the remainder were flights to test the UAVs in the harsh Antarctic conditions) over two months. This trip was one of the most productive scientific trips of my career based on the amount of data we collected in a relatively short amount of time.
This data, added to similar data I’ve collected with SUMO UAVs in January and September 2012 and Aerosonde UAV data that we collected in September 2009 and 2012, will ultimately help us better understand the boundary layer and improve weather and climate prediction. For me the ultimate goal of any of the research I do is to expand the bounds of our knowledge about how the atmosphere works and from what I’ve seen in the data we’ve collected there are lots of new things we can learn from this data.
Thanks for reading.
John
I found it interesting that the temperature profile changed as it did. Some of the times it seams that you were inverted as I would have expected with the temperature going up instead of down as your UAV increased in altitude.