Since my last blog post we left our position around latitude 58N and then sailed south along longitude 46W to latitude 54N. We then sat for 2 days through another mini-storm. Though not as strong as the previous one, this is a nice case study for us as the winds and sea state gradually increased in intensity. This also allowed the buoy team along with the crew members to repair the previously damaged buoy and re-deploy it to collect a nice set of wave data, important information to our project. All buoy systems are now operational and with time and practice the team and crew got better at recovering the buoy but this remains a delicate and stressful moment however.
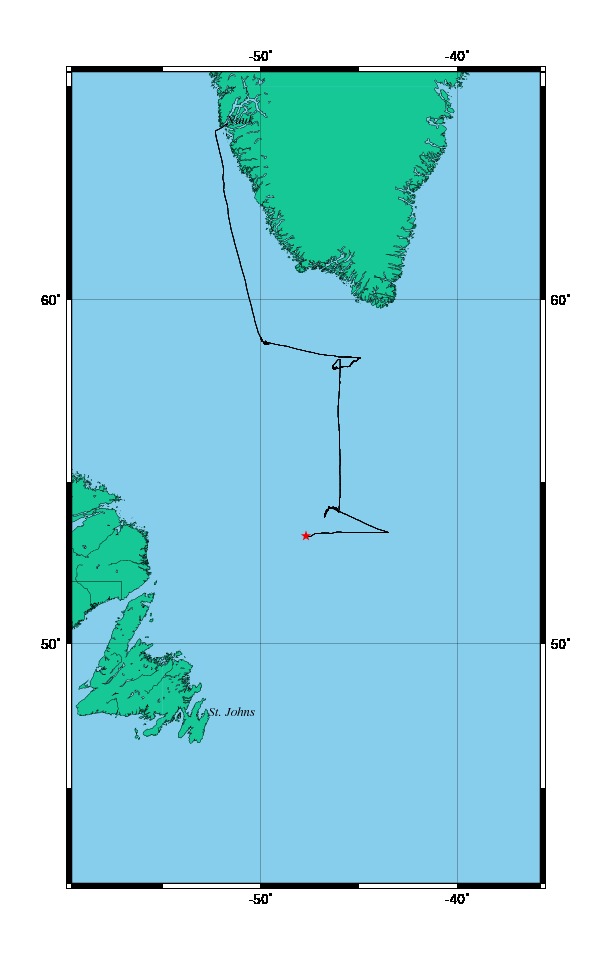
Ship’s track and our current location indicated by the red star
Since yesterday, we are now doing a survey around 53-54N to seek slightly better conditions to our experiment, i.e. sea waters richer in carbon dioxide (CO2) and Dimethyl Sulfide (DMS). What we have collected thus far is great but while the weather is calm it is in our advantage to sail around to seek stronger gas exchanges. This won’t last long though as we have a massive storm system heading towards us in a couple of days. This might be it, the best shot for our entire experiment! As you can see on the surface wind map below, the forecast calls for 26 m/s (or 50 knots) winds and up to 10m waves. We are all excited and getting ready for it!
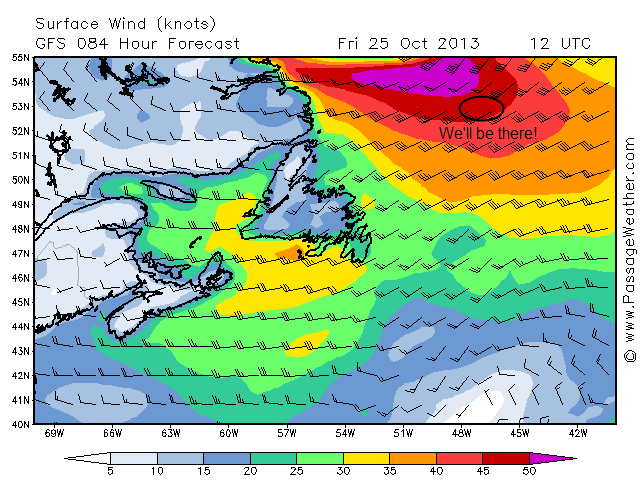
Where we plan to confront the storm!
As of now, we are carefully monitoring the forecasts to make sure we will meet the storm at the right place and at the right time. Our strategy is most likely to be in the area centered on 53N, 48W when the storm hits. We are planning to be in place by Thursday morning. We will then deploy the buoys to let them ride the big waves and the ship will be on station measuring flux of CO2 and other gases. We will then recover the buoys once the storm is over.
But “what the flux?” you may ask yourself. By definition a flux is a quantity that represents how much of something moves through a unit area per unit time. Let’s use an analogy with birds… below is a picture of Northern Fulmars that we have seen around the ship a few times. There are 7 birds riding with the waves (one of them is hiding behind another). Imagine a moment that the picture is a 1m x 1m window and that the waves carry those birds through that window (towards you) each minute – that would be a flux of 7 birds per square meter per minute (bird m2 min-1). If the window is 7m x 1m window, the flux is 1 bird m2 min-1.
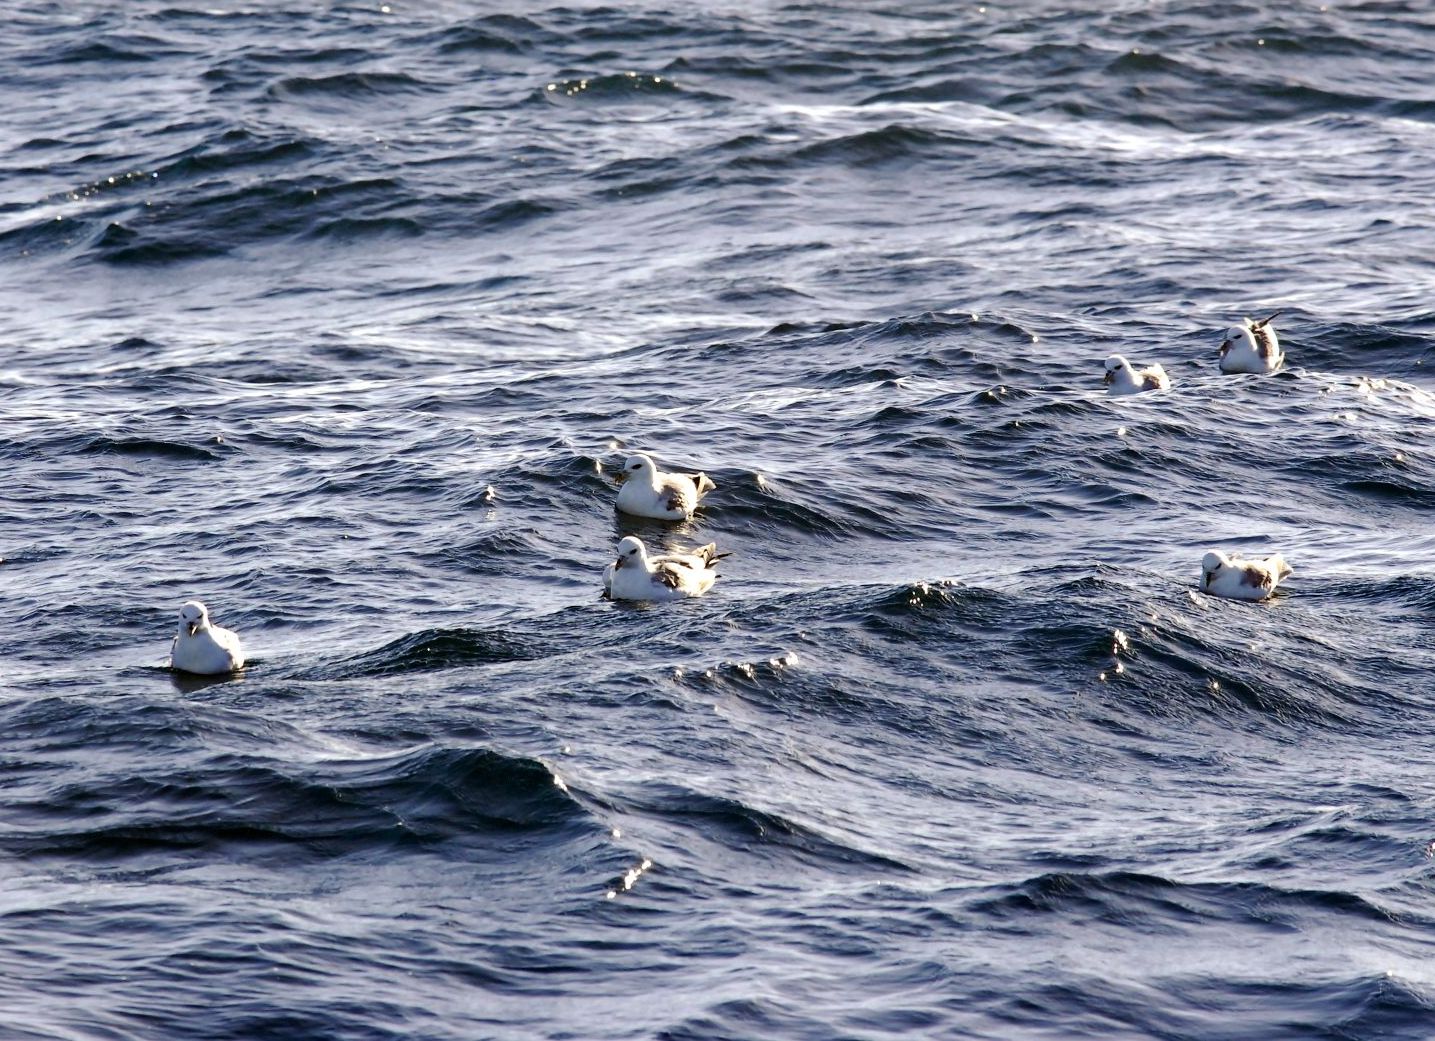
Do you see the 7th Fulmar?
In our case, we don’t really care about bird flux. Instead we prefer to count gas molecules like CO2, DMS, water (H2O) or methanol and see how they move between the atmosphere and the ocean surface. For that we are also interested by swirls called eddies. They dance around in the air and water (turbulence) and carry along variables (such as gas, temperature, concentration). The degree to which eddies and the other entities vary together is quantified by the “covariance”. This technique, often called the eddy-correlation or direct covariance method, allows us to determinate how much CO2 and other gases are going in and out of the ocean. In this part of the world we are in a sink region, i.e. the CO2 gets transferred from the atmosphere to the ocean.
What instrument do we use? To detect eddies, we use a sonic anemometer that measures the fast fluctuations of the wind in three directions. Along with it, we also have to very accurately measure the angular rates and accelerations of the ship (via a motion pack) to account and correct for the moving effects.
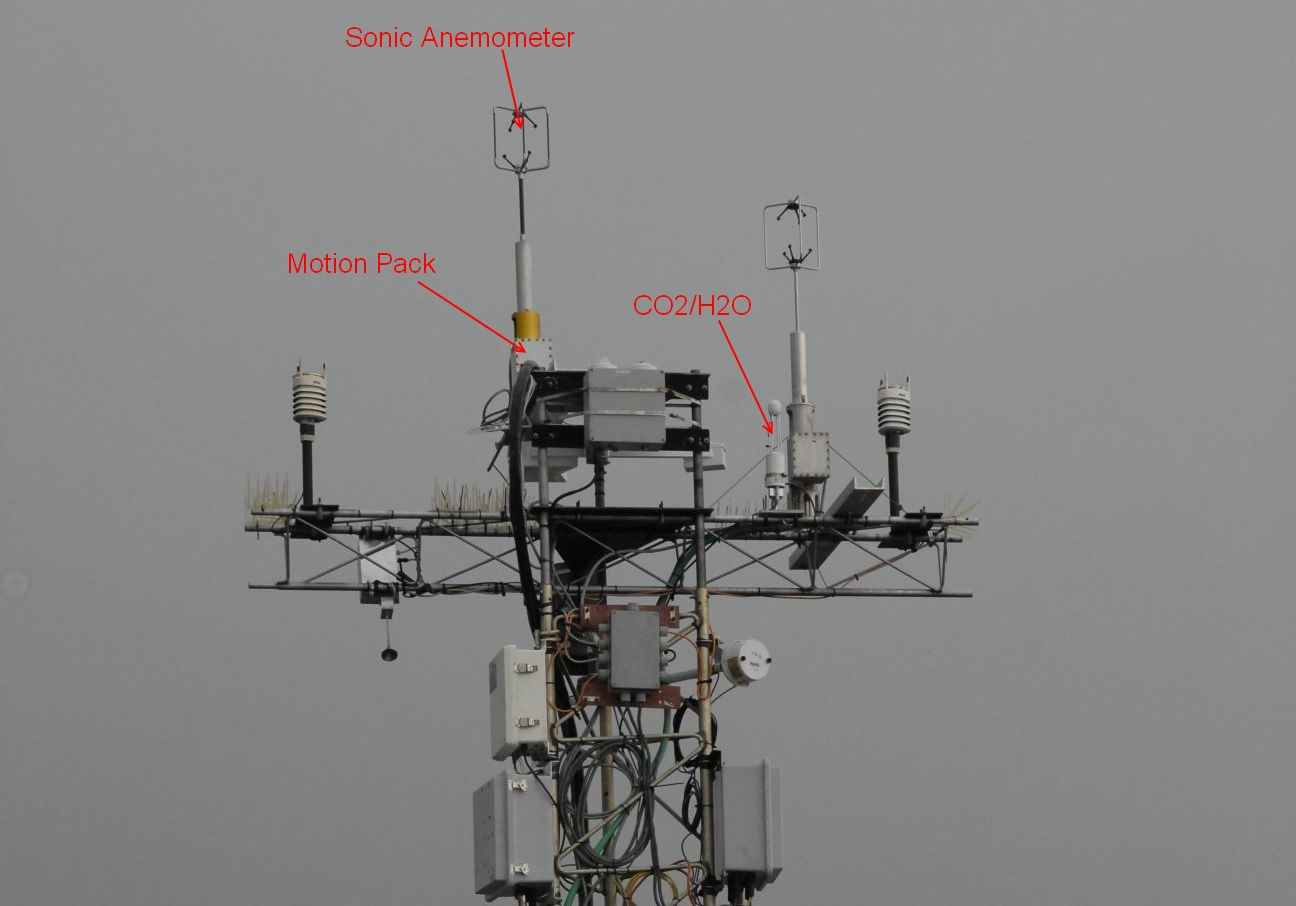
Ship’s forward mast with flux instrumentation setup for HiWinGS 2013.
To count the CO2 molecules, we currently have 4 different instruments measuring how much light is absorbed as molecules pass through. It is good to have redundancy in case something goes wrong. One of these instruments is mounted near the sonic anemometer on the ship’s forward mast. The three others, more bulky, are installed in a shipping container lab on the 02 deck. Air is drawn through a sampling line running from the mast to the instruments in the van.
To measure DMS or Methanol we make use of mass spectrometers which measure the masses and relative concentrations of the gas molecules. They are also located in a container lab.
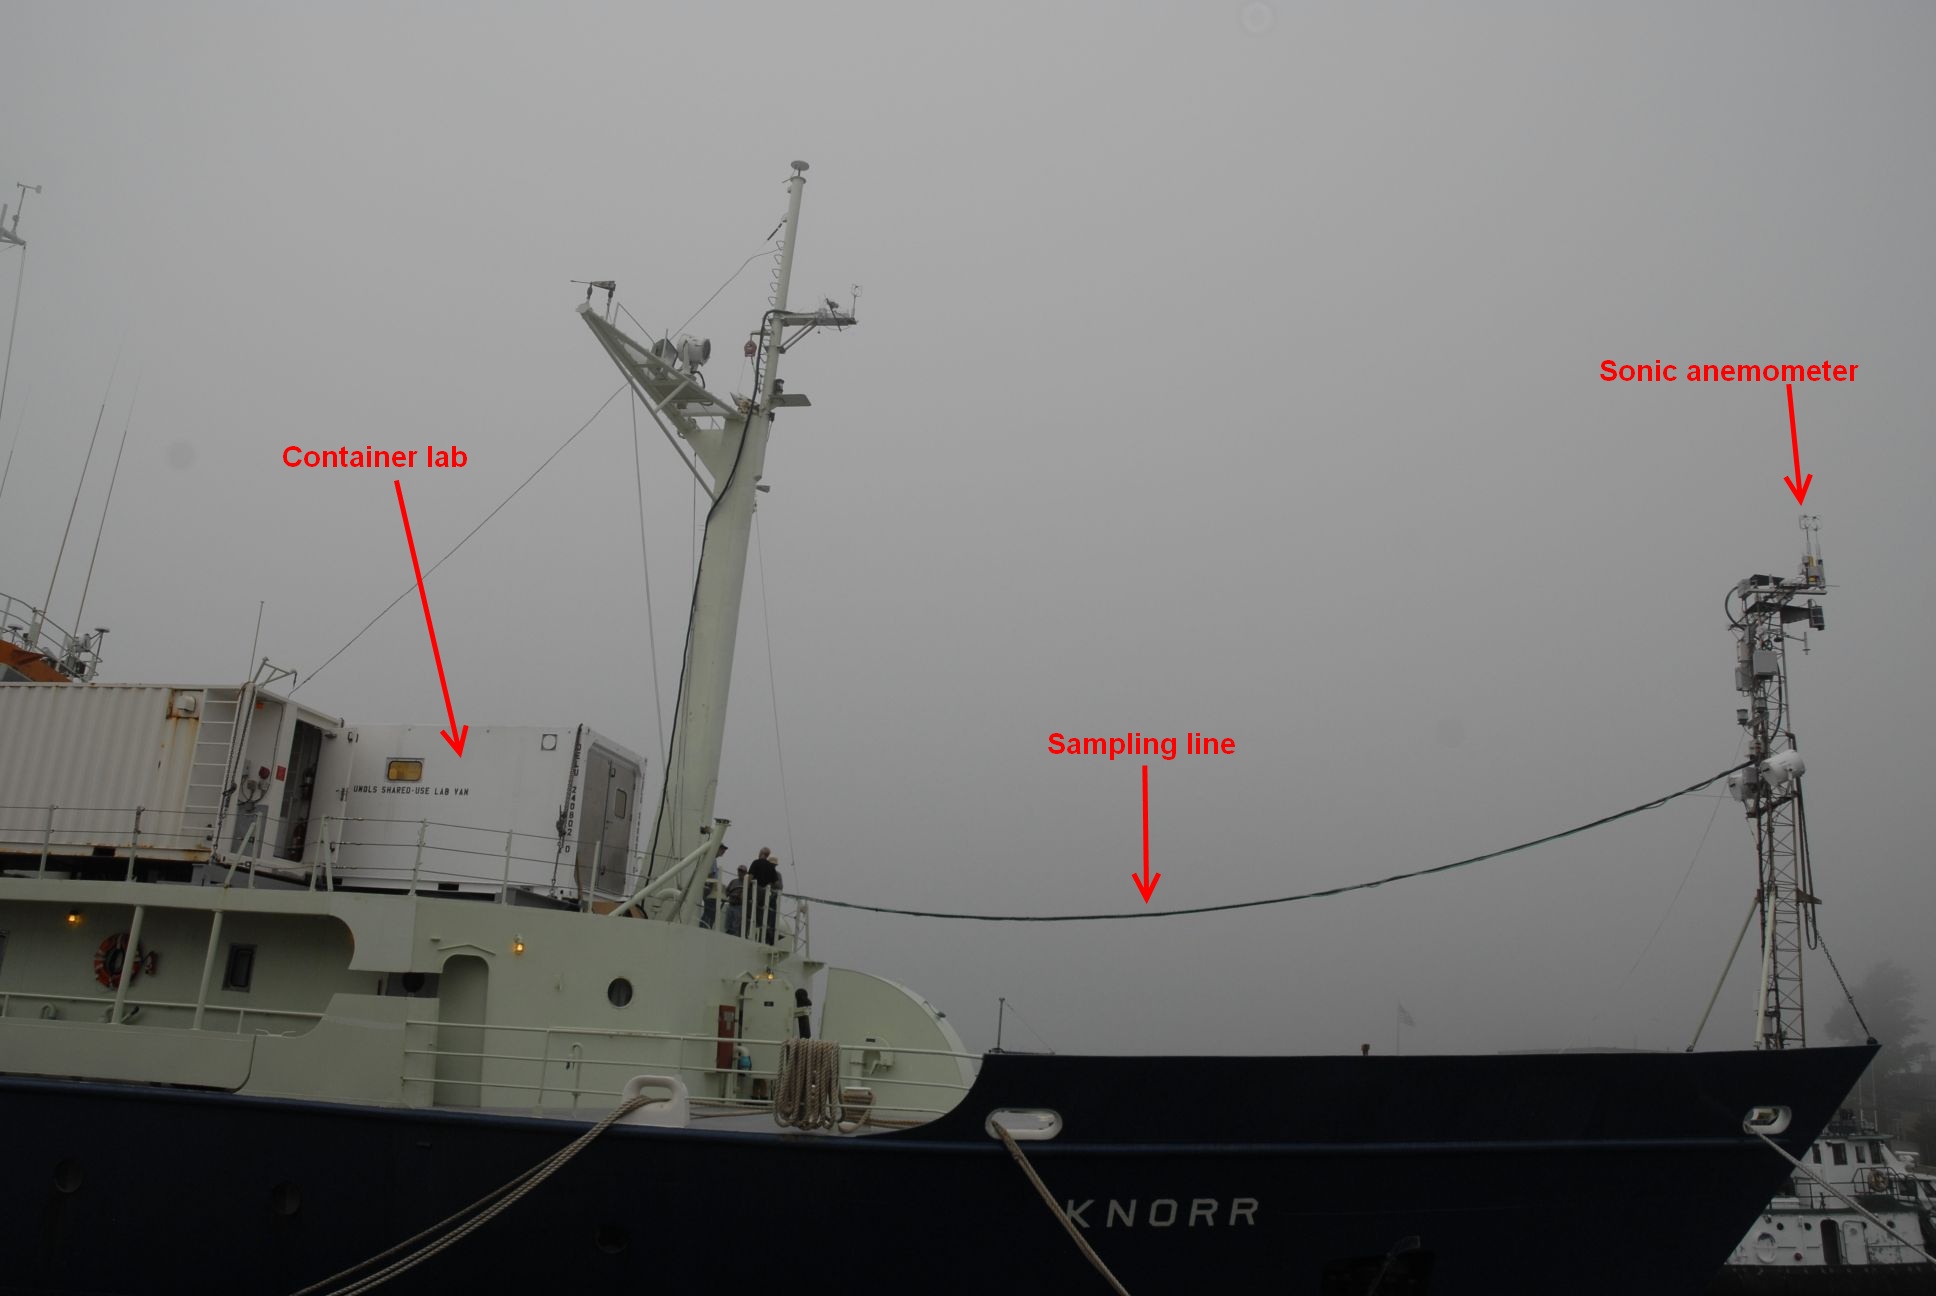
Side view of the ship showing the 30m-sampling line from the container lab up to the location of the mast flux sensors
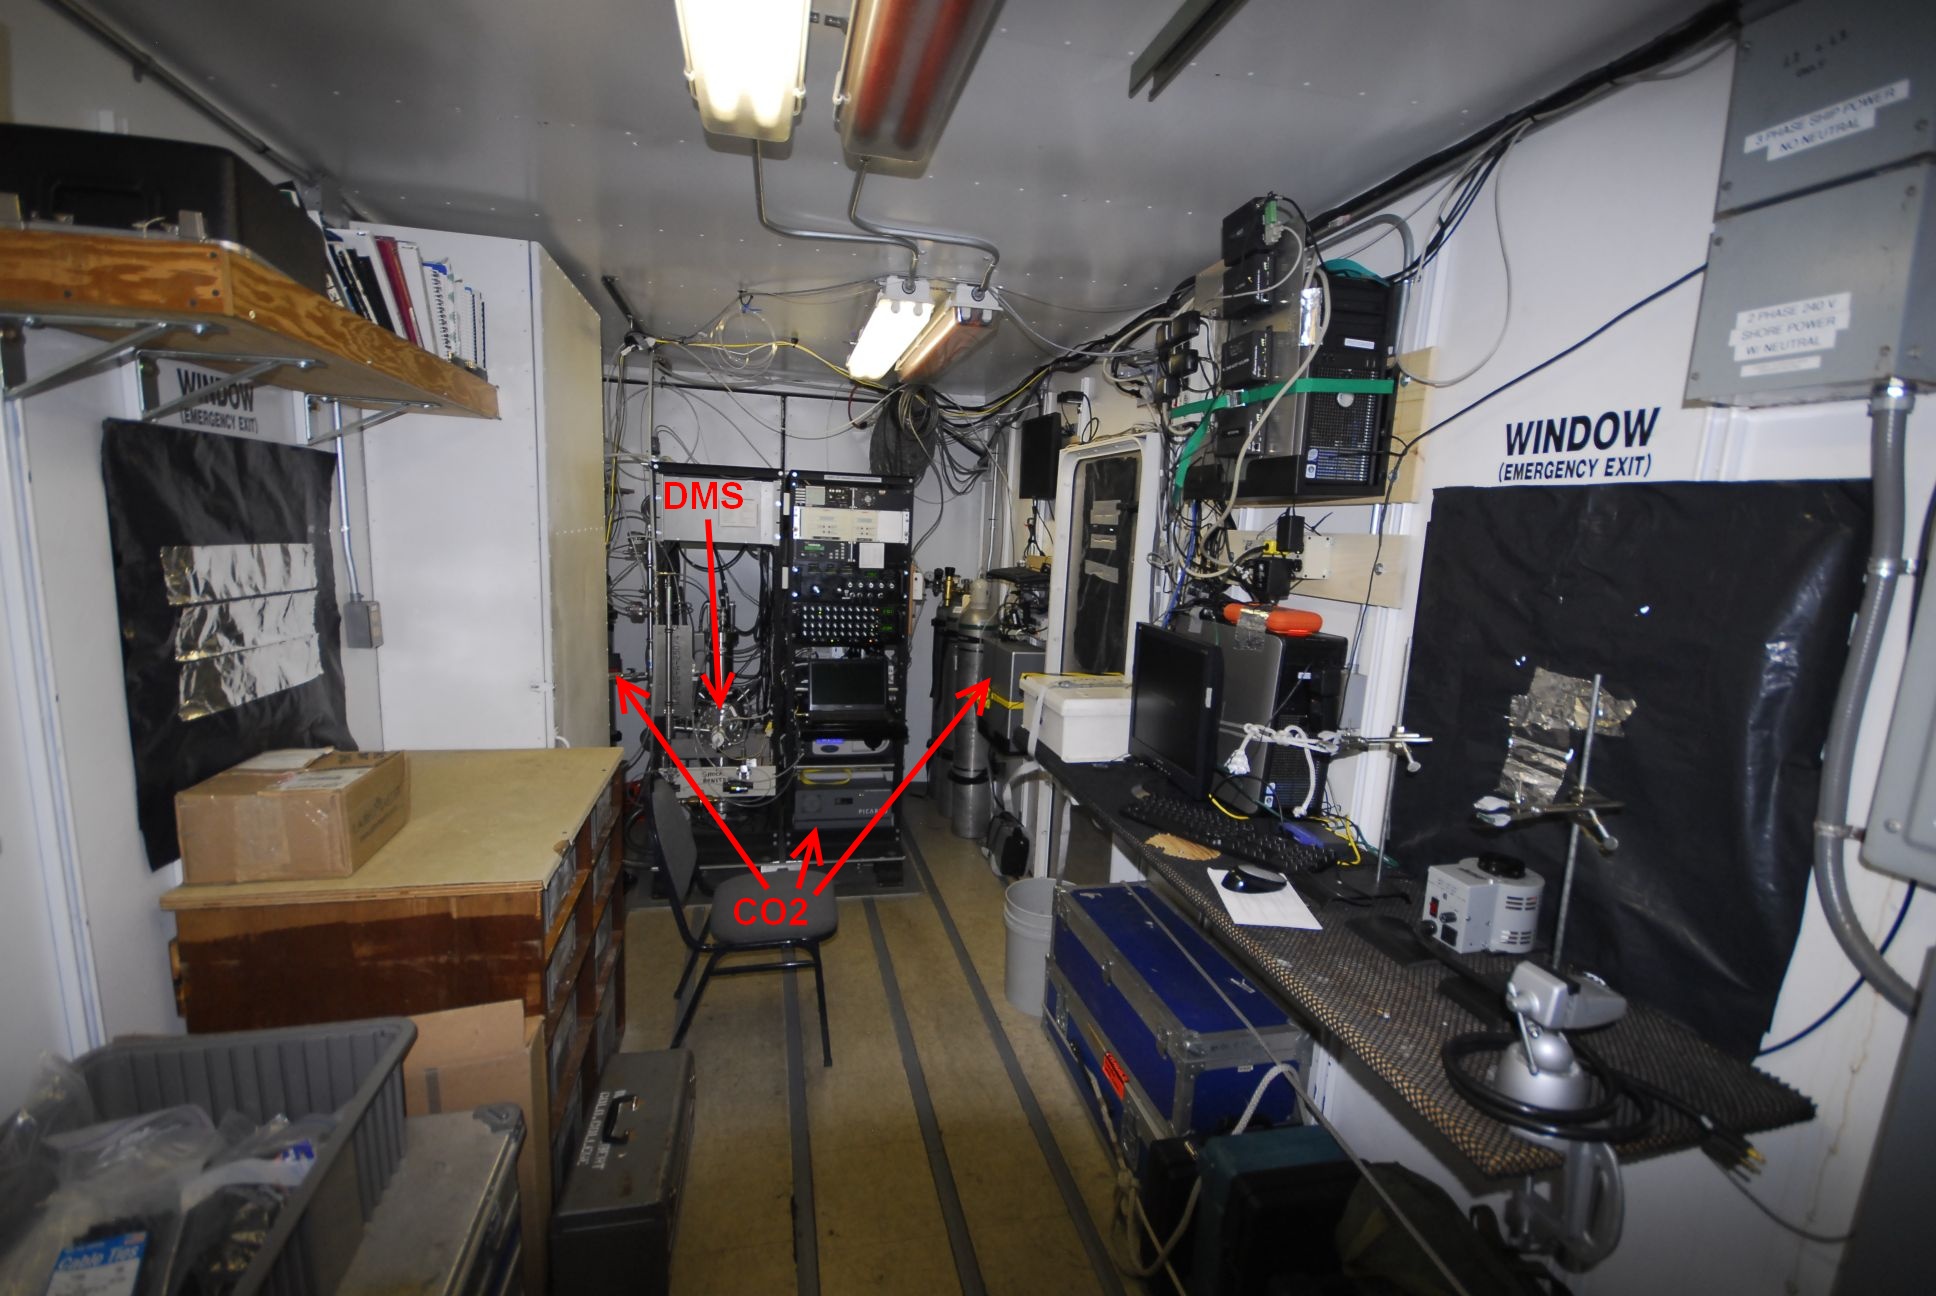
View inside one of the container lab. The CO2 and DMS instruments are in the background indicated by the red arrows.
Finally we also have other sensors to monitor some of the other variables that contribute to and regulate the gas flux. For that reason we measure CO2 and DMS concentrations (both in the sea water and in the air) and some meteorological data like wind, air temperature, humidity or sea surface temperature. The buoy and “waverider” are the devices used to measure the wave properties and I will describe them in a subsequent post. With that said, we had very little sun over the last days and through my window I can see it breaking through the clouds. Time to get my level of vitamin D back to normal prior the upcoming storm!