After launching weather balloons, I moved on to watching the teams at the Leach Airport in Center fly their aircraft and collect data. Yesterday, I was at the airport site where University of Colorado Boulder, University of Kentucky, University of Nebraska, and the Finnish Meteorological Institute conducted flights and gathered data.
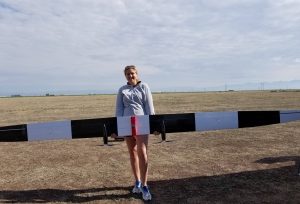
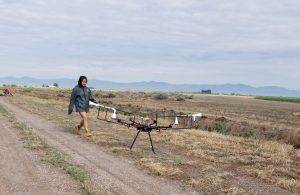
CU Boulder – Student holding a 15-foot rigid-wing UAV.
CU Boulder mentioned that they were measuring with a radiosonde on the TALON, a rigid-wing UAV with a styrofoam body. This plane was collecting 2D wind data, pressure, temperature, and humidity with the mission to create horizontal profiles of the atmosphere around the San Luis Valley. When I spoke with the students, they were getting it ready to fly and preparing the radiosonde to be attached. They had another aircraft with similar instruments called S1 Swift Trainer that made a couple fights too.
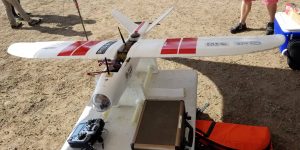
CU Boulder – the Talon.
Also, the team had their Mobile UAS Research Collaboratory (MURC) van with a tower coming through the roof and extending almost 60 feet up. The tower held a suite of instruments and sensors that measure temperature, wind speed and direction, pressure, and humidity. The main purpose of MURC here at Flight Week is to act as instrument calibration base for aircraft.
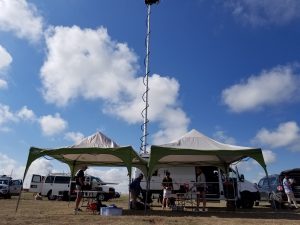
CU Boulder Team with the MURC in the background.
At the airport, I also found the University of Kentucky team making profiles. They were preparing their Blue Cat 6 rigid-wing UAV to fly for it’s first time in the Valley. They were first going to fly it with weights to substitute the load of the instruments and then make measurements if all went well. The plane would be measuring wind data with a special intake tube at the nose and distribute currents from different directions into thin tubes. The tubes hook into sensors that read in data to a small computer on board.
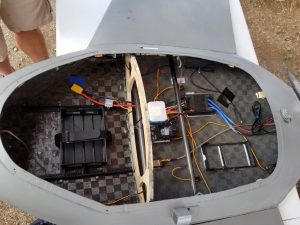
University of Kentucky – Empty Blue Cat 6 ready to be weighted and flown for its first time in SLV.
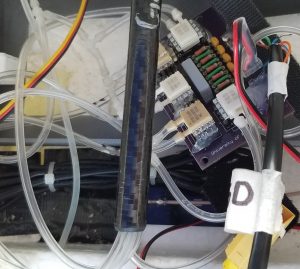
University of Kentucky – wind reader sending individual directional currents to sensor.
University of Nebraska had a special UAV that carried a different set up for its wind sensor. The fairly heavy drone had a pair of horns that would intake the wind and aspirate the sensors to provide faster readings. The importance behind an aspirated sensor and response time is because of the changes in atmospheric temperature. Most sensors are slow reading, where, without airflow, it could be a few minutes before a precise measurement is given. In this case, your temperature measurement might not read what it actually is, and by time it would the temperature may have already changed. The drone also recorded temperature, pressure, and humidity in vertical ascents.
University of Nebraska – Special aspirating temperature measurements.
A team from the Finnish Meteorological Institute was also located at the airport base. The scientists here were conducting vertical profiles for gas and particle modules. Specifically, they were running 10 minute flights on two drones, one gathering particle concentration and the other gas concentration data. The gas measuring drone carried sensors for CO2 (carbon dioxide), water vapor, SO2 (sulfur dioxide), pressure, temperature, and humidity. The particle concentration sensor makes its measurement by counting particles with and optical particle counter (OPC) which sees coarse particles (3nm and above). It also makes use of an condensation particle counter (CPC) which sees fine particles in the nanometer scale. All the instrument’s data was eventually sent to a single file in an ASCII format. These vertical profiles will be useful for analyzing how much number of particles and gases there are to put in the modal and see how they react with each other.
Last but certainly not least, I met Ajit Ahlawat, coming from the CISR-National Physical Laboratory New Delhi, India. Working on a PhD in instrumentation for gas and particle concentration measurements, he is here to discover more about the different technologies, instrument designs, and ideas that engineers and scientist are using to conduct research. His focus is in instrument design, atmospheric instrumentation, and aerosol physicochemical properties. It is also his first time in the U.S. and so far, apart from visa issues, he is enjoying himself.
