As conveyed, we are struggling to use our aircraft to the extent we’re used to, but that doesn’t mean that we’re going to come home empty handed. Although it sometimes seems a bit futile, over the last two days, we’ve continued to launch and fly the aircraft and let them collect data for as long as they can before interference forces us to land. This has resulted in some really neat measurements!
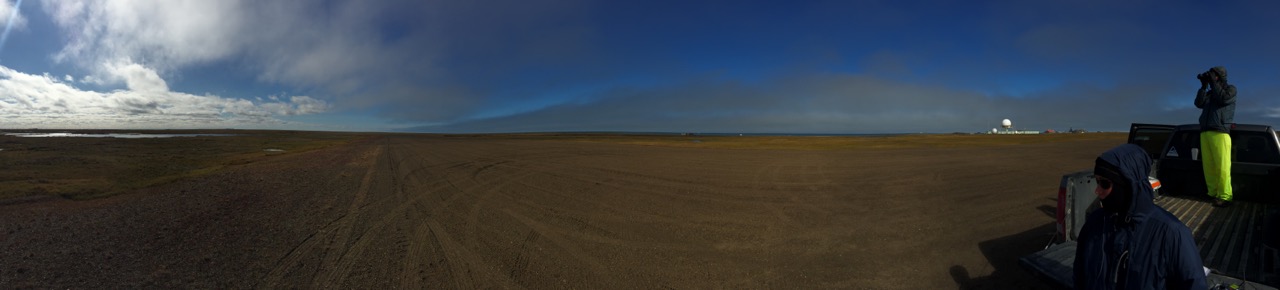
Al (with binoculars) surveying for wildlife, and Will (foreground) getting ready to fly. This is the low cloud scene that we were sampling today!
As an example, today we woke up to find some very low clouds — with the bottom of the clouds at only 100 meters above the ground. Initially, this looked like a dire situation, since the majority of our interference issues had been at 150 m and below, and given the interference we’ve been facing, we are currently not willing to take the aircraft into clouds where we can not see them. However, we decided to go out and sample to the best of our ability. Initially, this meant a “rinse and repeat” sort of approach, where we launched the airplanes, profiled between 50-100 m as long as the radar allowed, and then landed, rebooted, and sent it back on its way. As time went on, however, the clouds began thinning, and we were able to make measurements throughout the layer where the (now thin and transparent) clouds were sitting. This layer persisted for the entire day, with upper level clouds slowly dissipating, and a strong inversion layer (which used to be directly above the lower level clouds) sticking around into the evening. The figure below shows what a day’s worth of temperature profiling looks like. The inversion layer can be seen as the sharp increase in temperature starting at around 150 m. It remains frustrating that we can’t sample this sort of event reliably and continuously as we had hoped and expected due to the interference, but still very excited to dig into these measurements further!
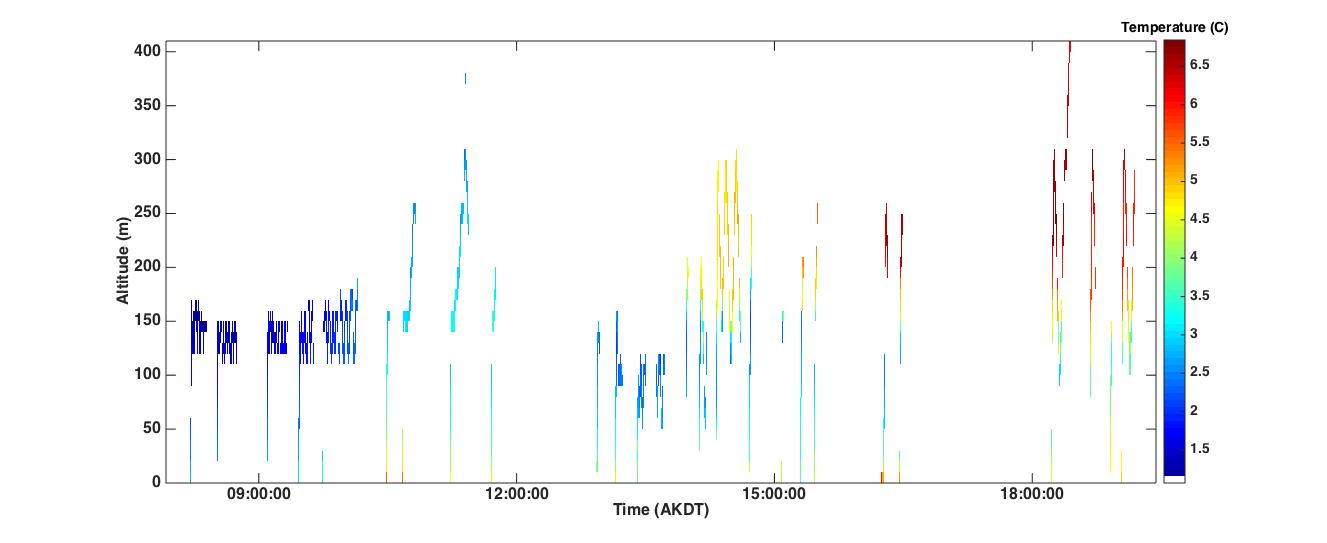
The colors represent temperatures (in time-height space) from all of the profiles flown today (08/12).
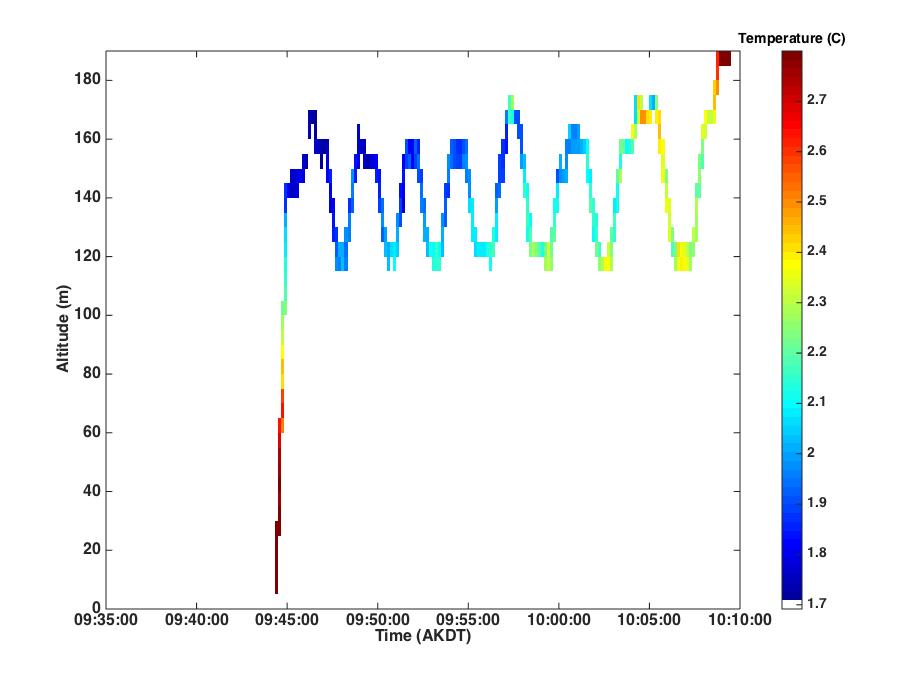
A single temperature profile from this morning. Note how much change and fine scale structure exists over a relatively short time period!
We have three more days to collect as many measurements as possible, and I’m looking to make the most of it. Good night from Oliktok!
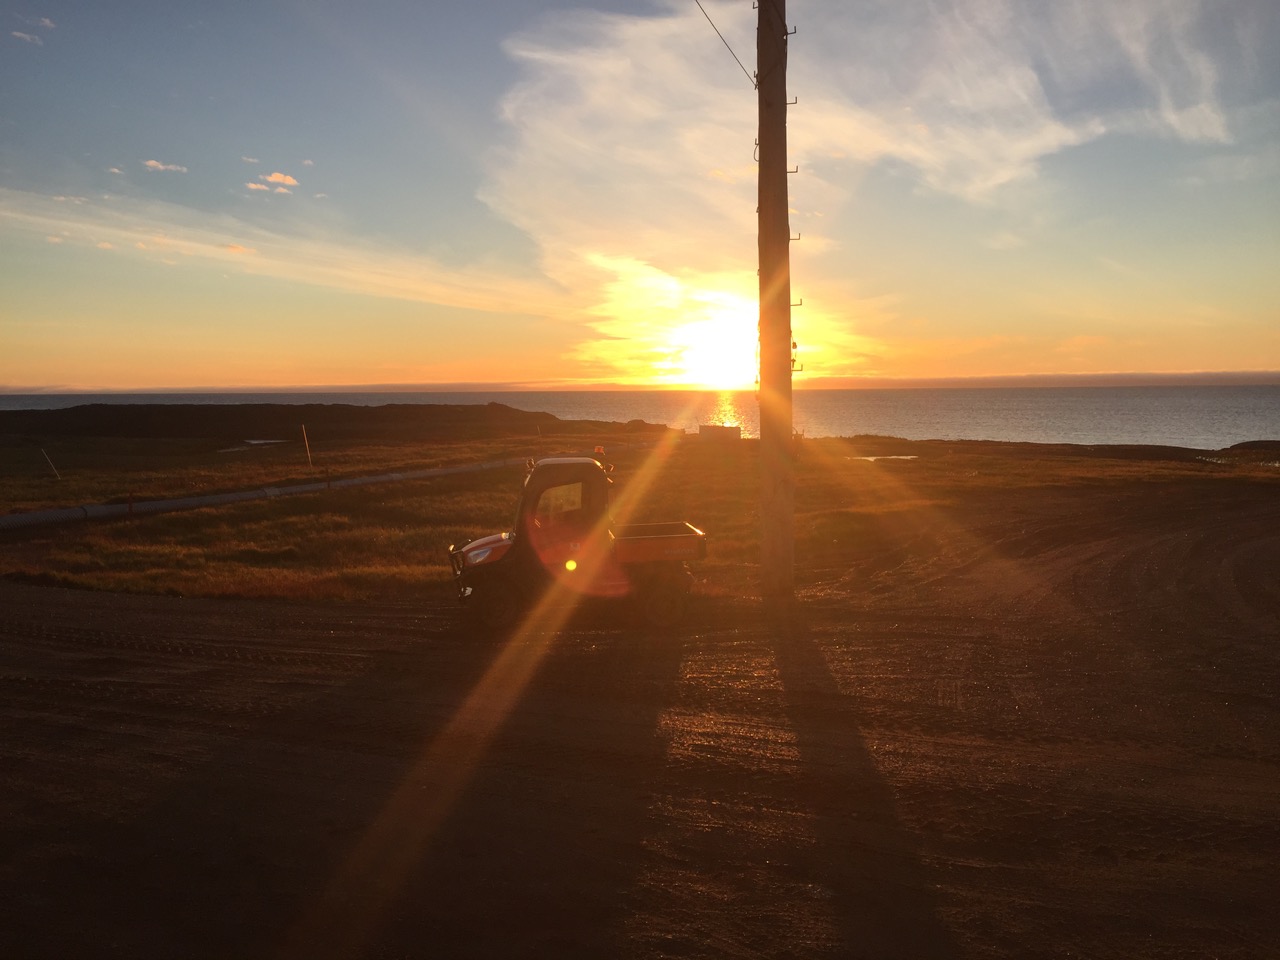
The sun trying to set over the Arctic Ocean at 11 pm. Good night!