Kara and I have been in Antarctica for 2.5 weeks now and have another 1.5 weeks left until we are scheduled to fly north. As I mentioned in my last blog post the drones we were planning to use for our fieldwork never made it down to McMurdo so we have been improvising to do some useful research while we are here. In today’s post I’ll talk about what fieldwork we had planned to do with our drones and what we are actually doing without them.
The research project we are working on is funded by a grant from the National Science Foundation (NSF), as is almost all of the research that is done in McMurdo. The research we have been funded to do is to make measurements of the atmospheric boundary layer over the Antarctic ice sheet using a combination of a 30 m (100 foot) tall automatic weather station (AWS) tower, that we refer to simply as a tall tower AWS and uncrewed aerial systems (UAS), or drones.
This is our project’s tall tower AWS located just a few miles from McMurdo. This AWS was installed in January 2025, after lots of hard work by our collaborators in the AWS group at the University of Wisconsin, led by Dr. Matthew Lazzara, and the US Antarctic Program logistics team. You can see me at the bottom of the tower to give you a sense of scale. Weather instruments at 6 different heights on the tower measure wind speed and direction, temperature and humidity. You can see the aerovanes that measure wind on the right side of the tower.
So, what is the atmospheric boundary layer and why would we propose to study it during an Antarctic field campaign? The atmospheric boundary layer is the lowest part of the atmosphere and can range from just a few tens of feet deep to a mile or more deep. The boundary layer is always turbulent, unlike the rest of the atmosphere which is usually not turbulent. We perceive the turbulence in the boundary layer as the gustiness of the wind. More importantly this turbulence helps transfer heat, moisture and other properties, like pollutants, between the surface of the Earth and the atmosphere. One tangible impact of this exchange is the daily rise and fall of temperature. During the day when the ground absorbs sunlight and warms up energy from the heated ground is transferred, by turbulence, into the atmosphere resulting in warm daytime temperatures. At night, when the sun sets the ground emits longwave radiation and cools. The boundary layer once again responds to this changing surface temperature by cooling down. Your experience that it is cool in the morning and warm in the afternoon is because the air in the boundary layer, where we live, is responding to changes in energy input or loss from the ground. If we lived above the boundary layer the temperature wouldn’t rise and fall each day but would change slowly over several days as weather fronts moved through.
In this video you can see a shimmering over Observation Hill (on the left side of the video) and the ice near McMurdo. This shimmering is a result of turbulence subtly altering the vertical temperature gradient in the atmosphere which causes the light we are seeing to refract in a random pattern.
For the research we proposed for this project we planned to make measurements that would help us better understand the exchange of energy between the surface of the Antarctic ice sheet and the atmosphere. There are several reasons why this is of interest to polar scientists.
First, as the Earth warms, ice in the polar regions experience more periods of melt in the summer. We will use observations from our 30 m tall tower weather station to study the details of these melt events and how energy is being exchanged between the atmosphere and the surface. One question we hope to answer with this data is if the melt is being driven primarily by sunlight being absorbed by the ice sheet or do some melt events occur when unusually warm air gets blown over the ice sheet and then turbulence transfers energy from the warm air to the ice causing it to melt?
Second, the details of the turbulent transfer of heat, and other properties, between the air in the boundary layer and the Earth’s surface is one of the things weather and climate models have a hard time representing accurately. They struggle most with this when the ground is much colder than the overlying air – something that happens regularly in Antarctica in the winter. By making measurements of the atmospheric boundary layer during the end of the Antarctic winter we will gather data that will help us improve how the exchange of heat between the atmosphere and ice sheet is represented in weather and climate models resulting in more accurate weather forecasts and climate projections.
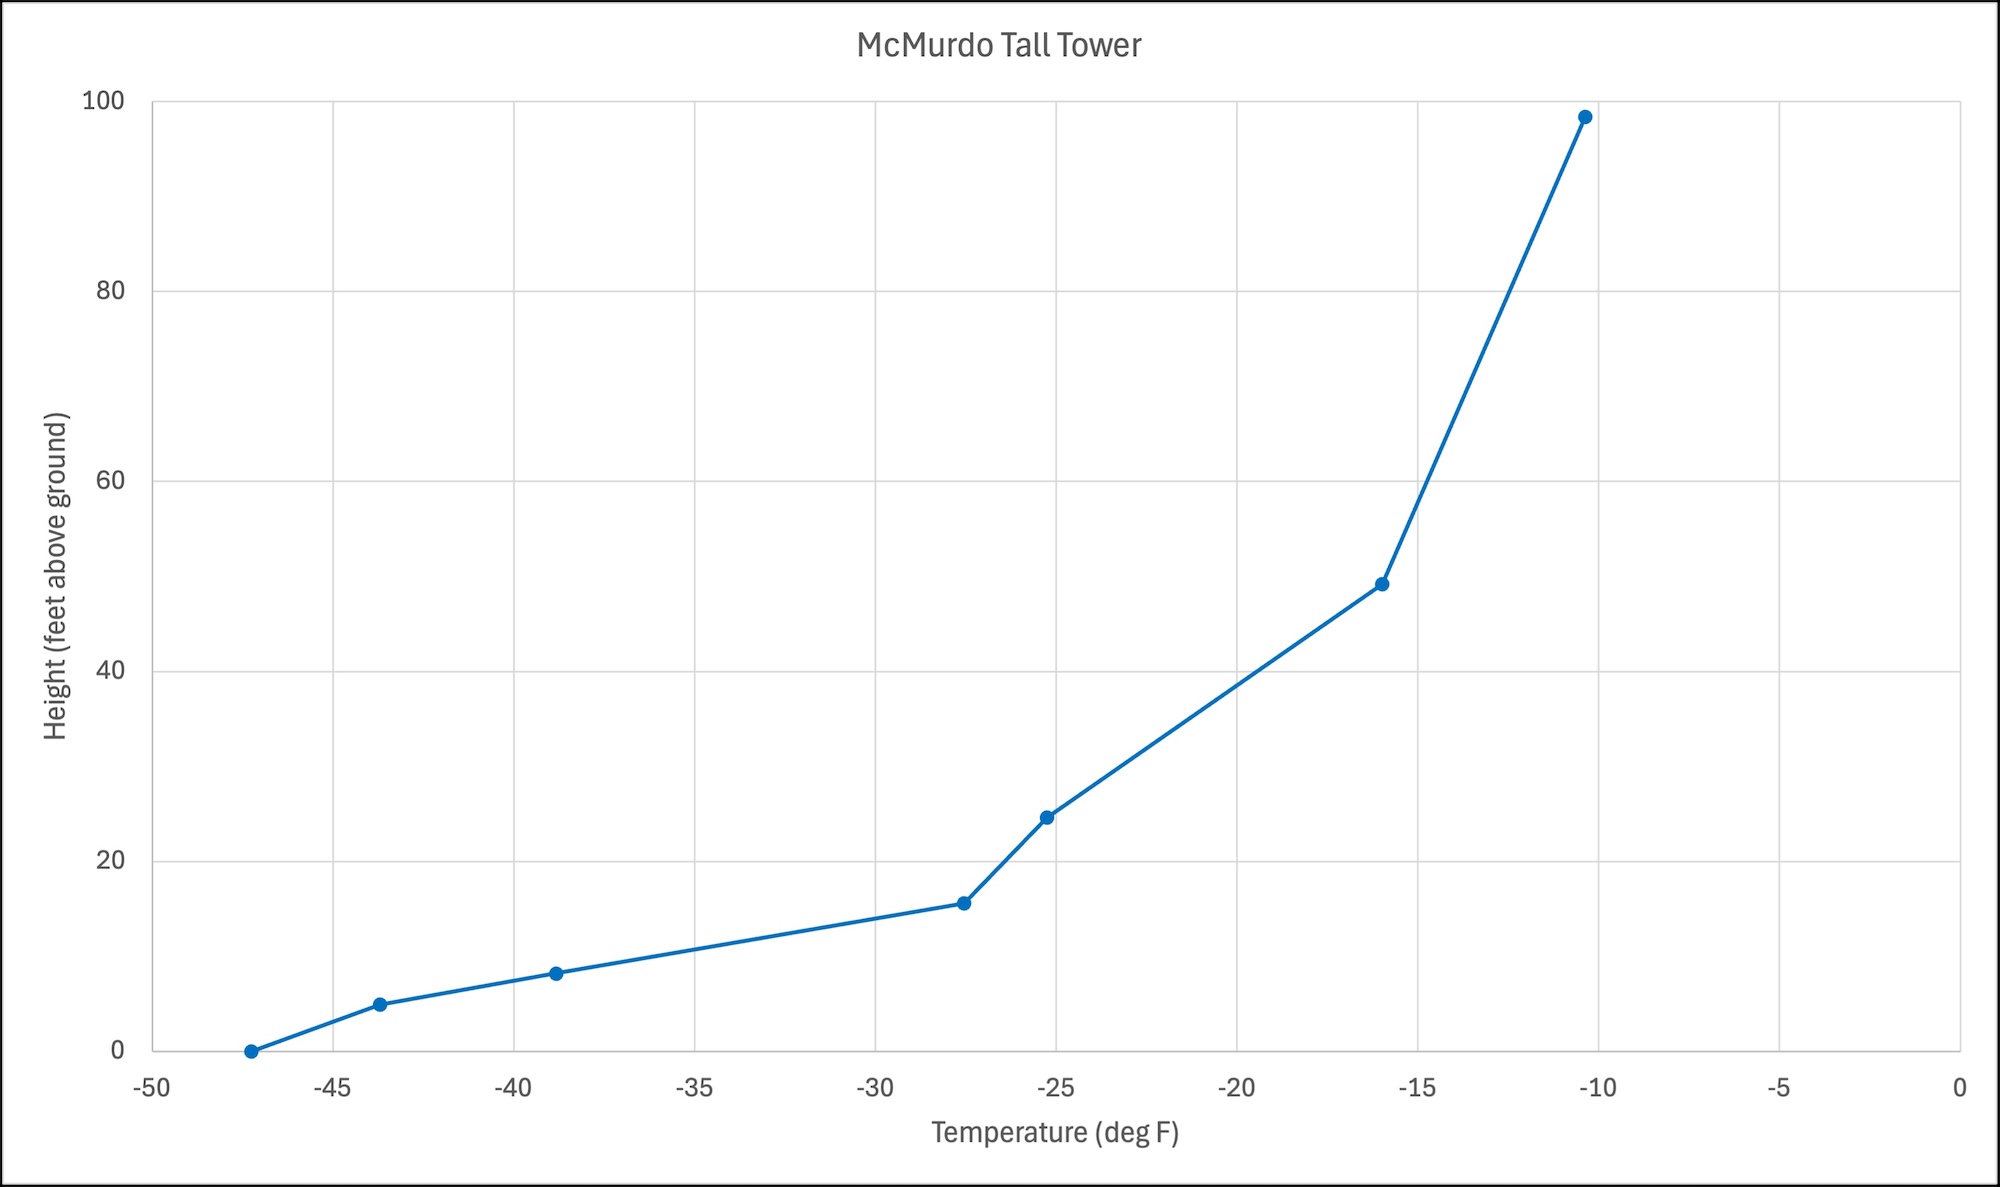
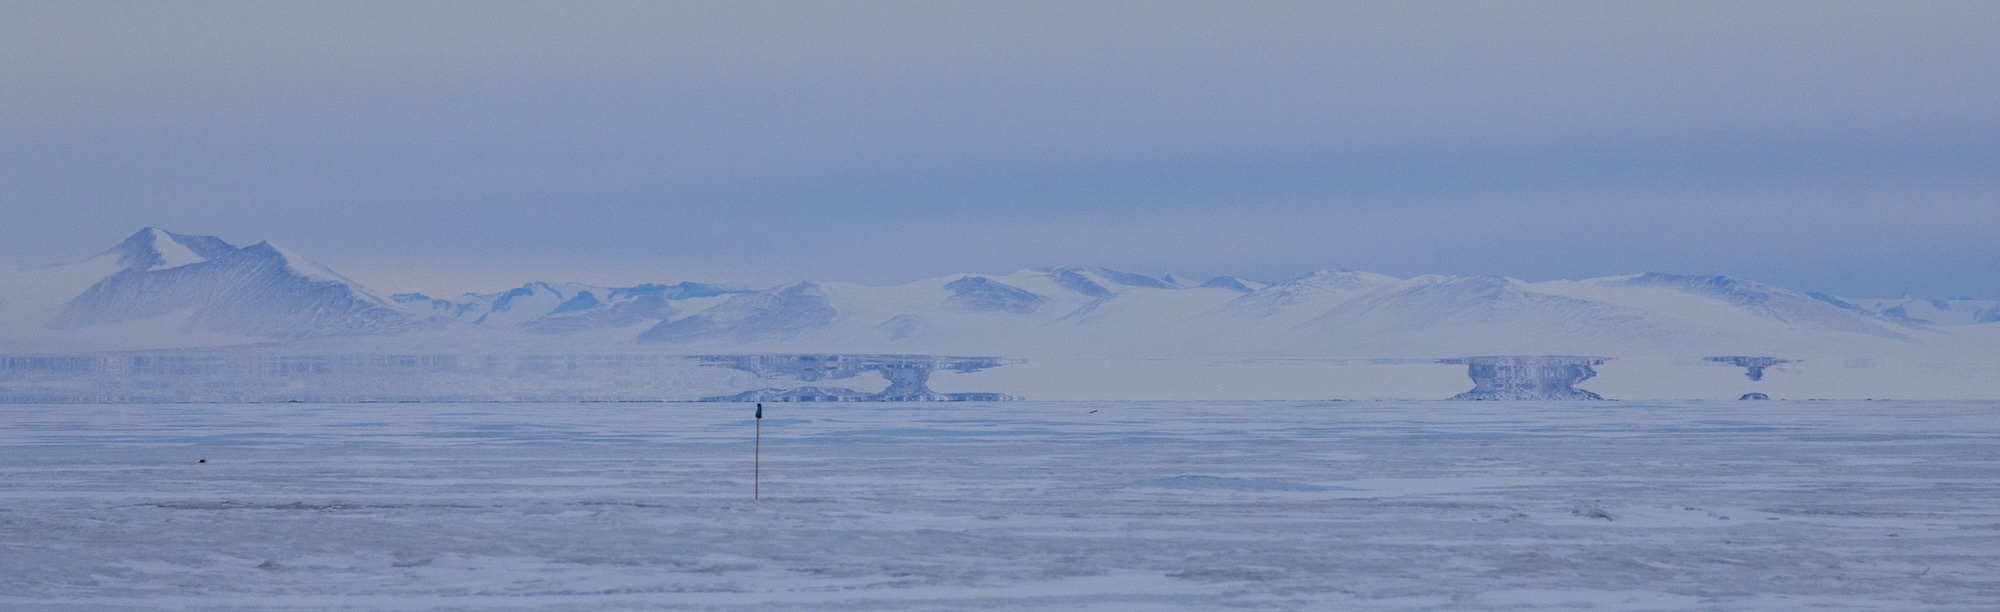
This graph shows a vertical temperature profile measured by the tall tower AWS. The blue line shows temperatures warming more than 35 deg F, from near -45 deg F at the ice surface, at the bottom left of the graph, to near -10 deg F 100 feet above the ground, at the top right of the graph. This increase of temperature with height is known as a temperature inversion. The larger the increase in temperature with height the less turbulent the boundary layer will be which reduces how much heat, and other properties, are mixed between the air and the ground. It is these strong inversion conditions that weather and climate models struggle to represent.Strong temperature inversions like the one shown on the graph above cause light to refract as it passes through the atmosphere causing the shimmering seen in the video above. Under the right conditions the inversion creates an optical illusion called a fata morgana, seen in this picture. A fata morgana causes light coming from objects near the horizon to bend such that they look as if they are coming from higher in the atmosphere resulting in a vertical stretching of objects near the ground. In this photograph the mirror image of the dark, bare ground on the horizon is a fata morgana caused by a strong temperature inversion over the ice surface.
Our plan for this Winfly field season was that we would attach weather sensors to quadcopter drones to make measurements of vertical temperature profiles under a variety of weather conditions. The drone profiles would extend the depth of atmosphere we could study beyond what the tall tower AWS observes. Unfortunately, without our drones we cannot do this part of our proposed research.
Instead, Kara and I have attached our drone weather sensors to a van. Several times a day we use the weather sensor on our van to measure how much the temperature changes along the 15 mile snow road from McMurdo to the Phoenix ice runway. We will use this data to evaluate how well the weather models used to make weather forecasts in Antarctica simulate the temperature variability near McMurdo and the runway.
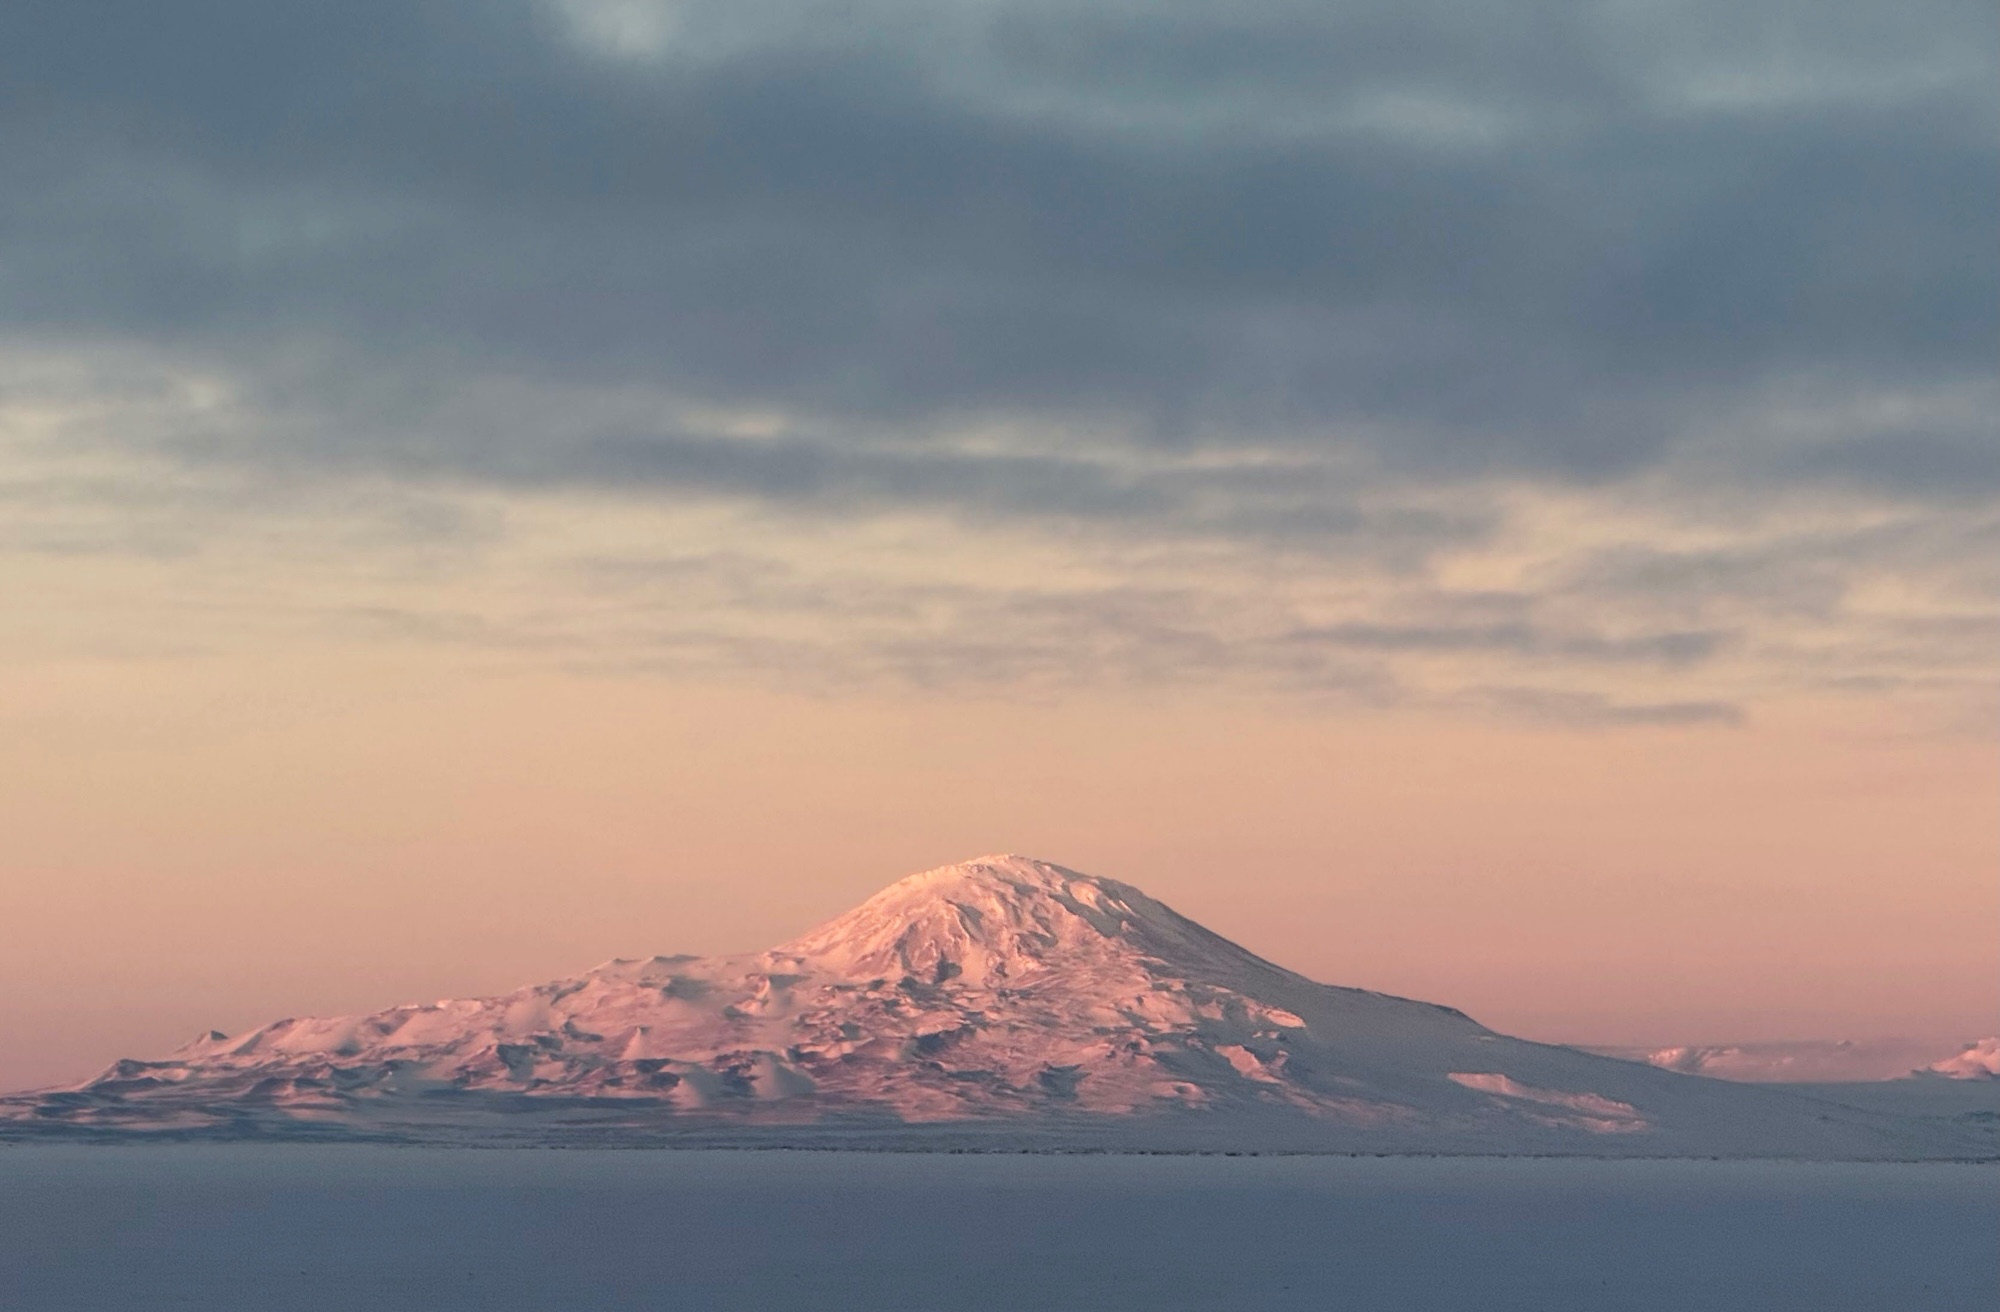
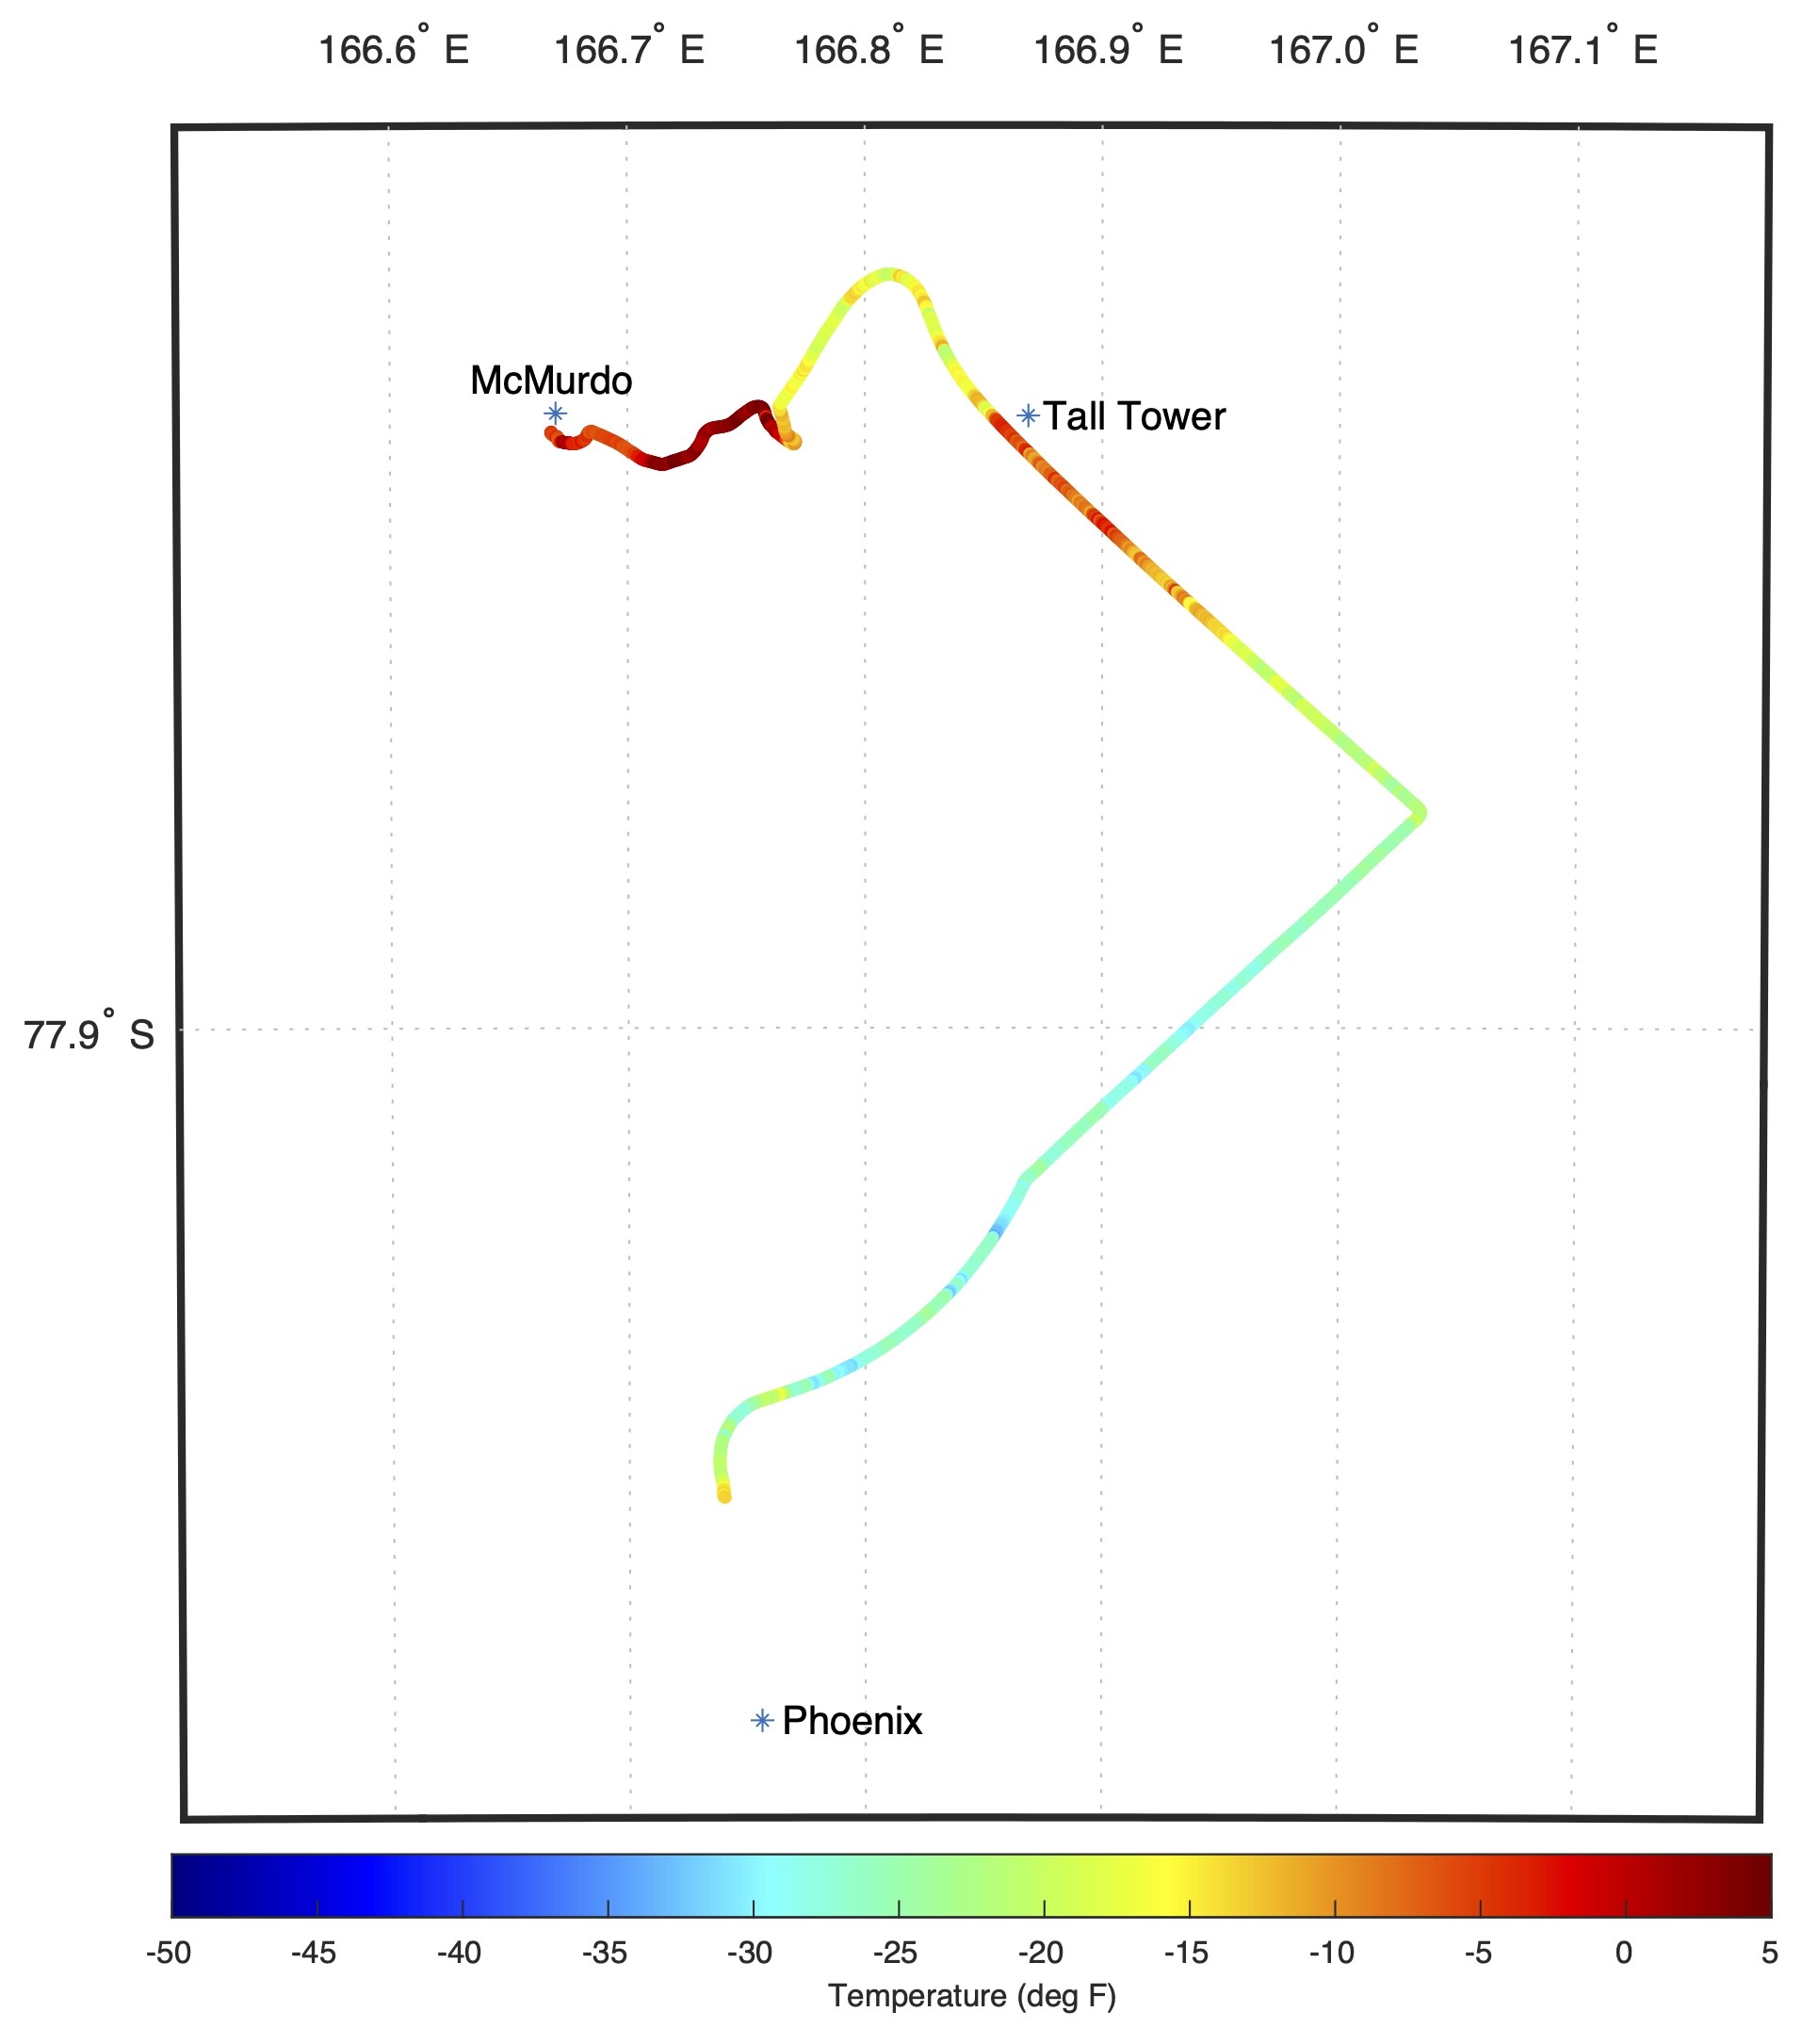
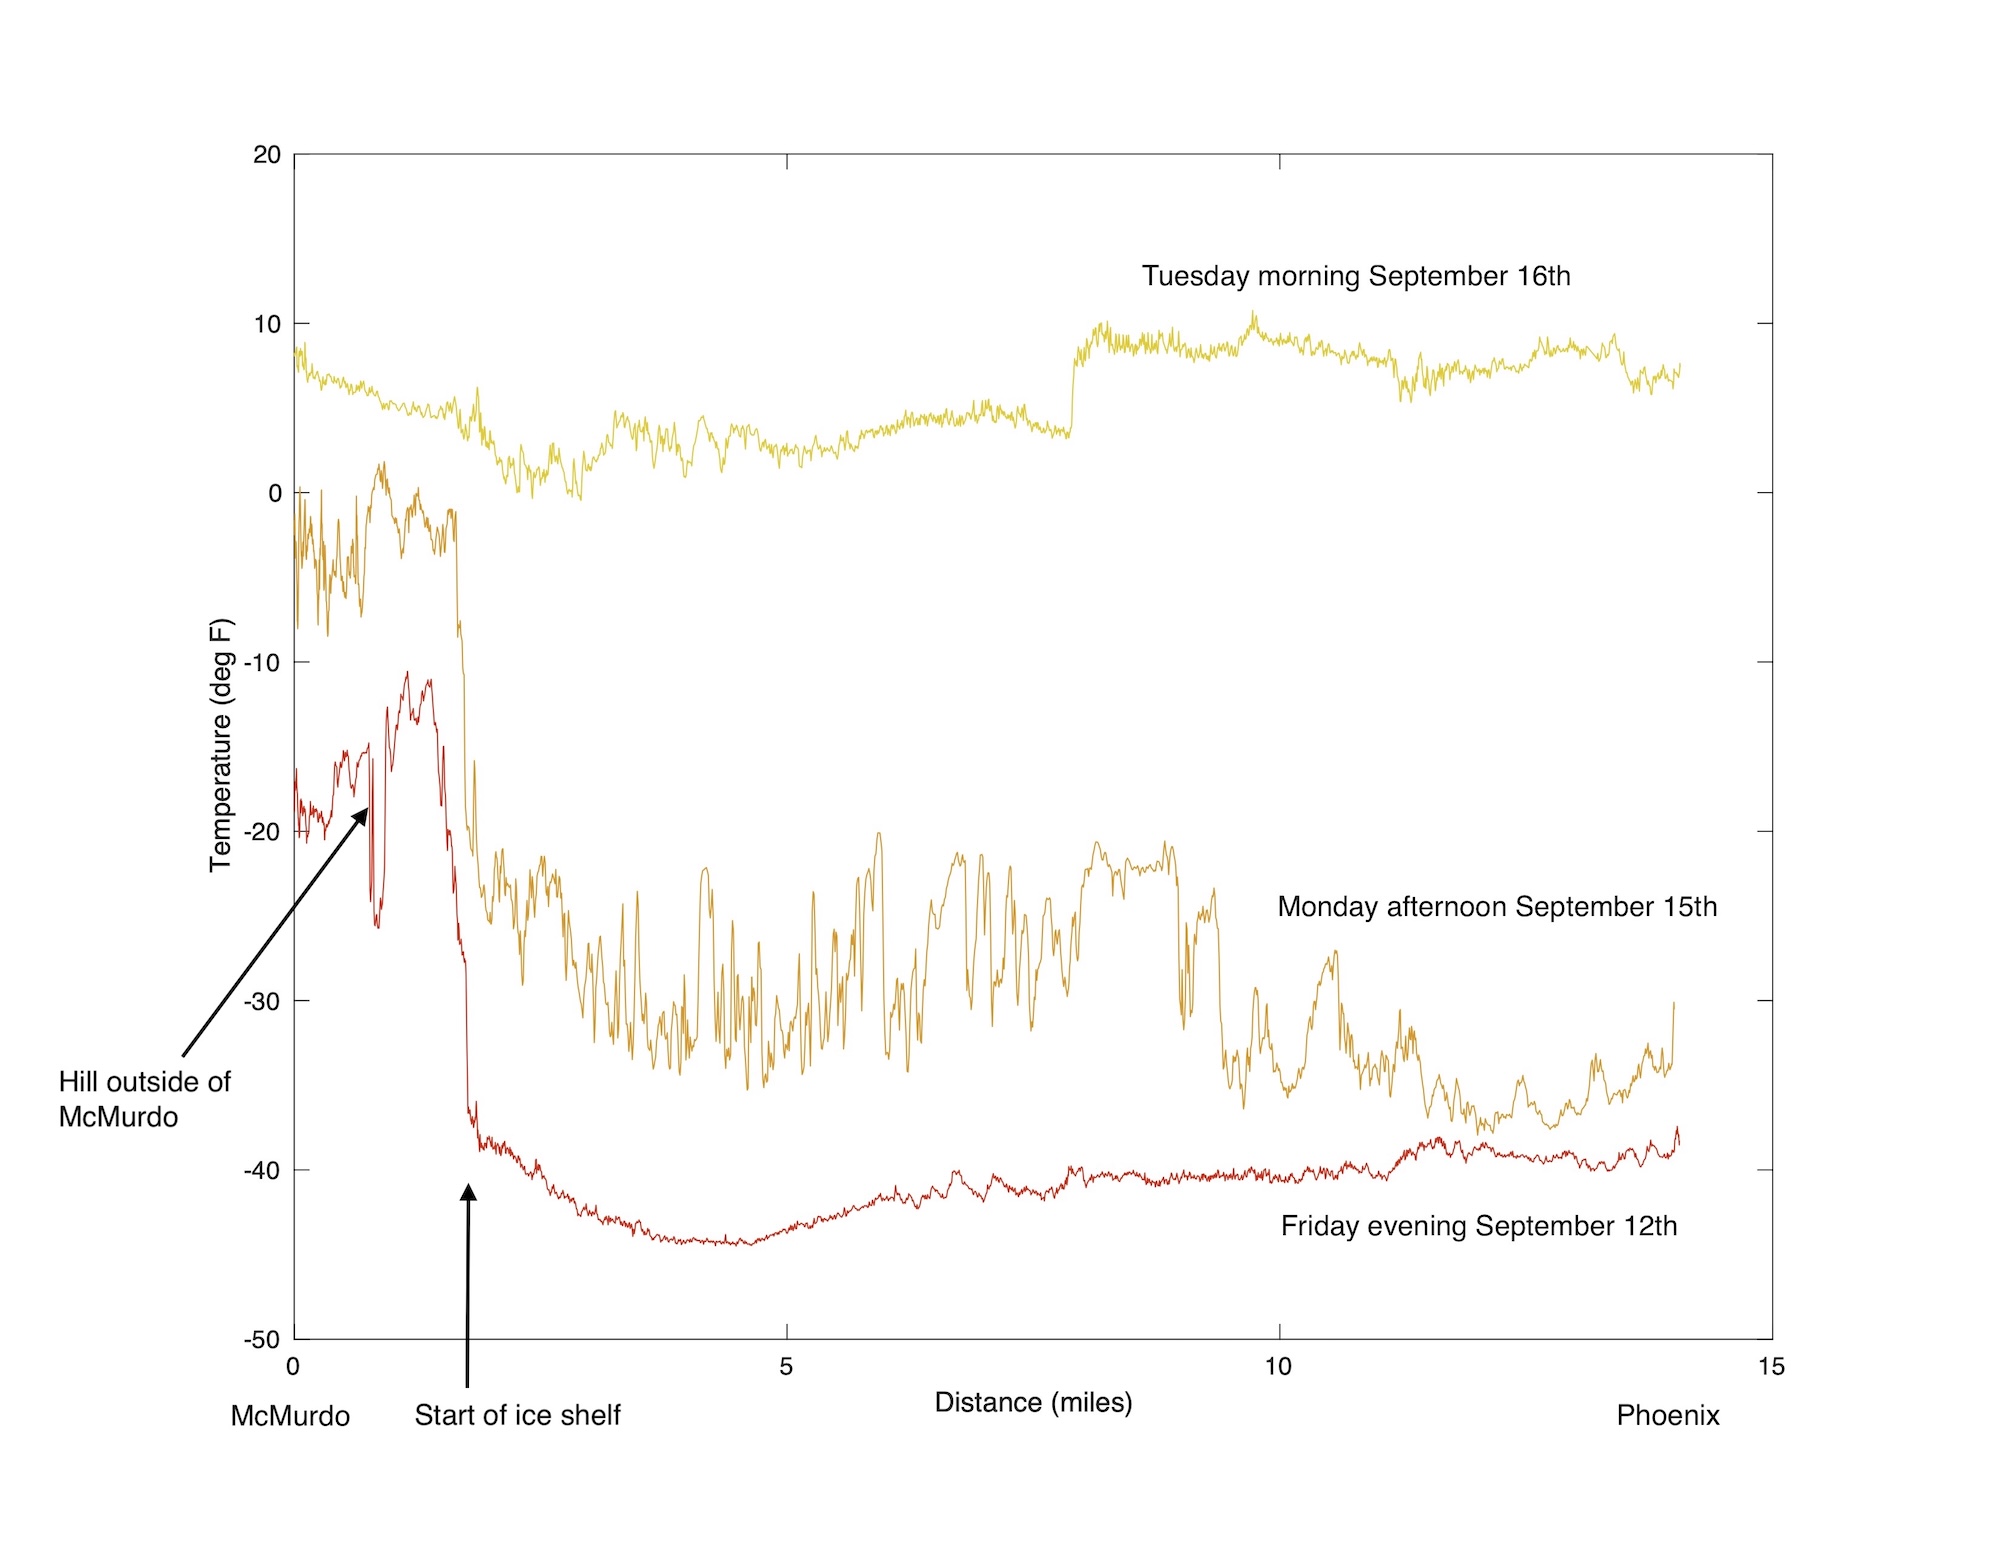
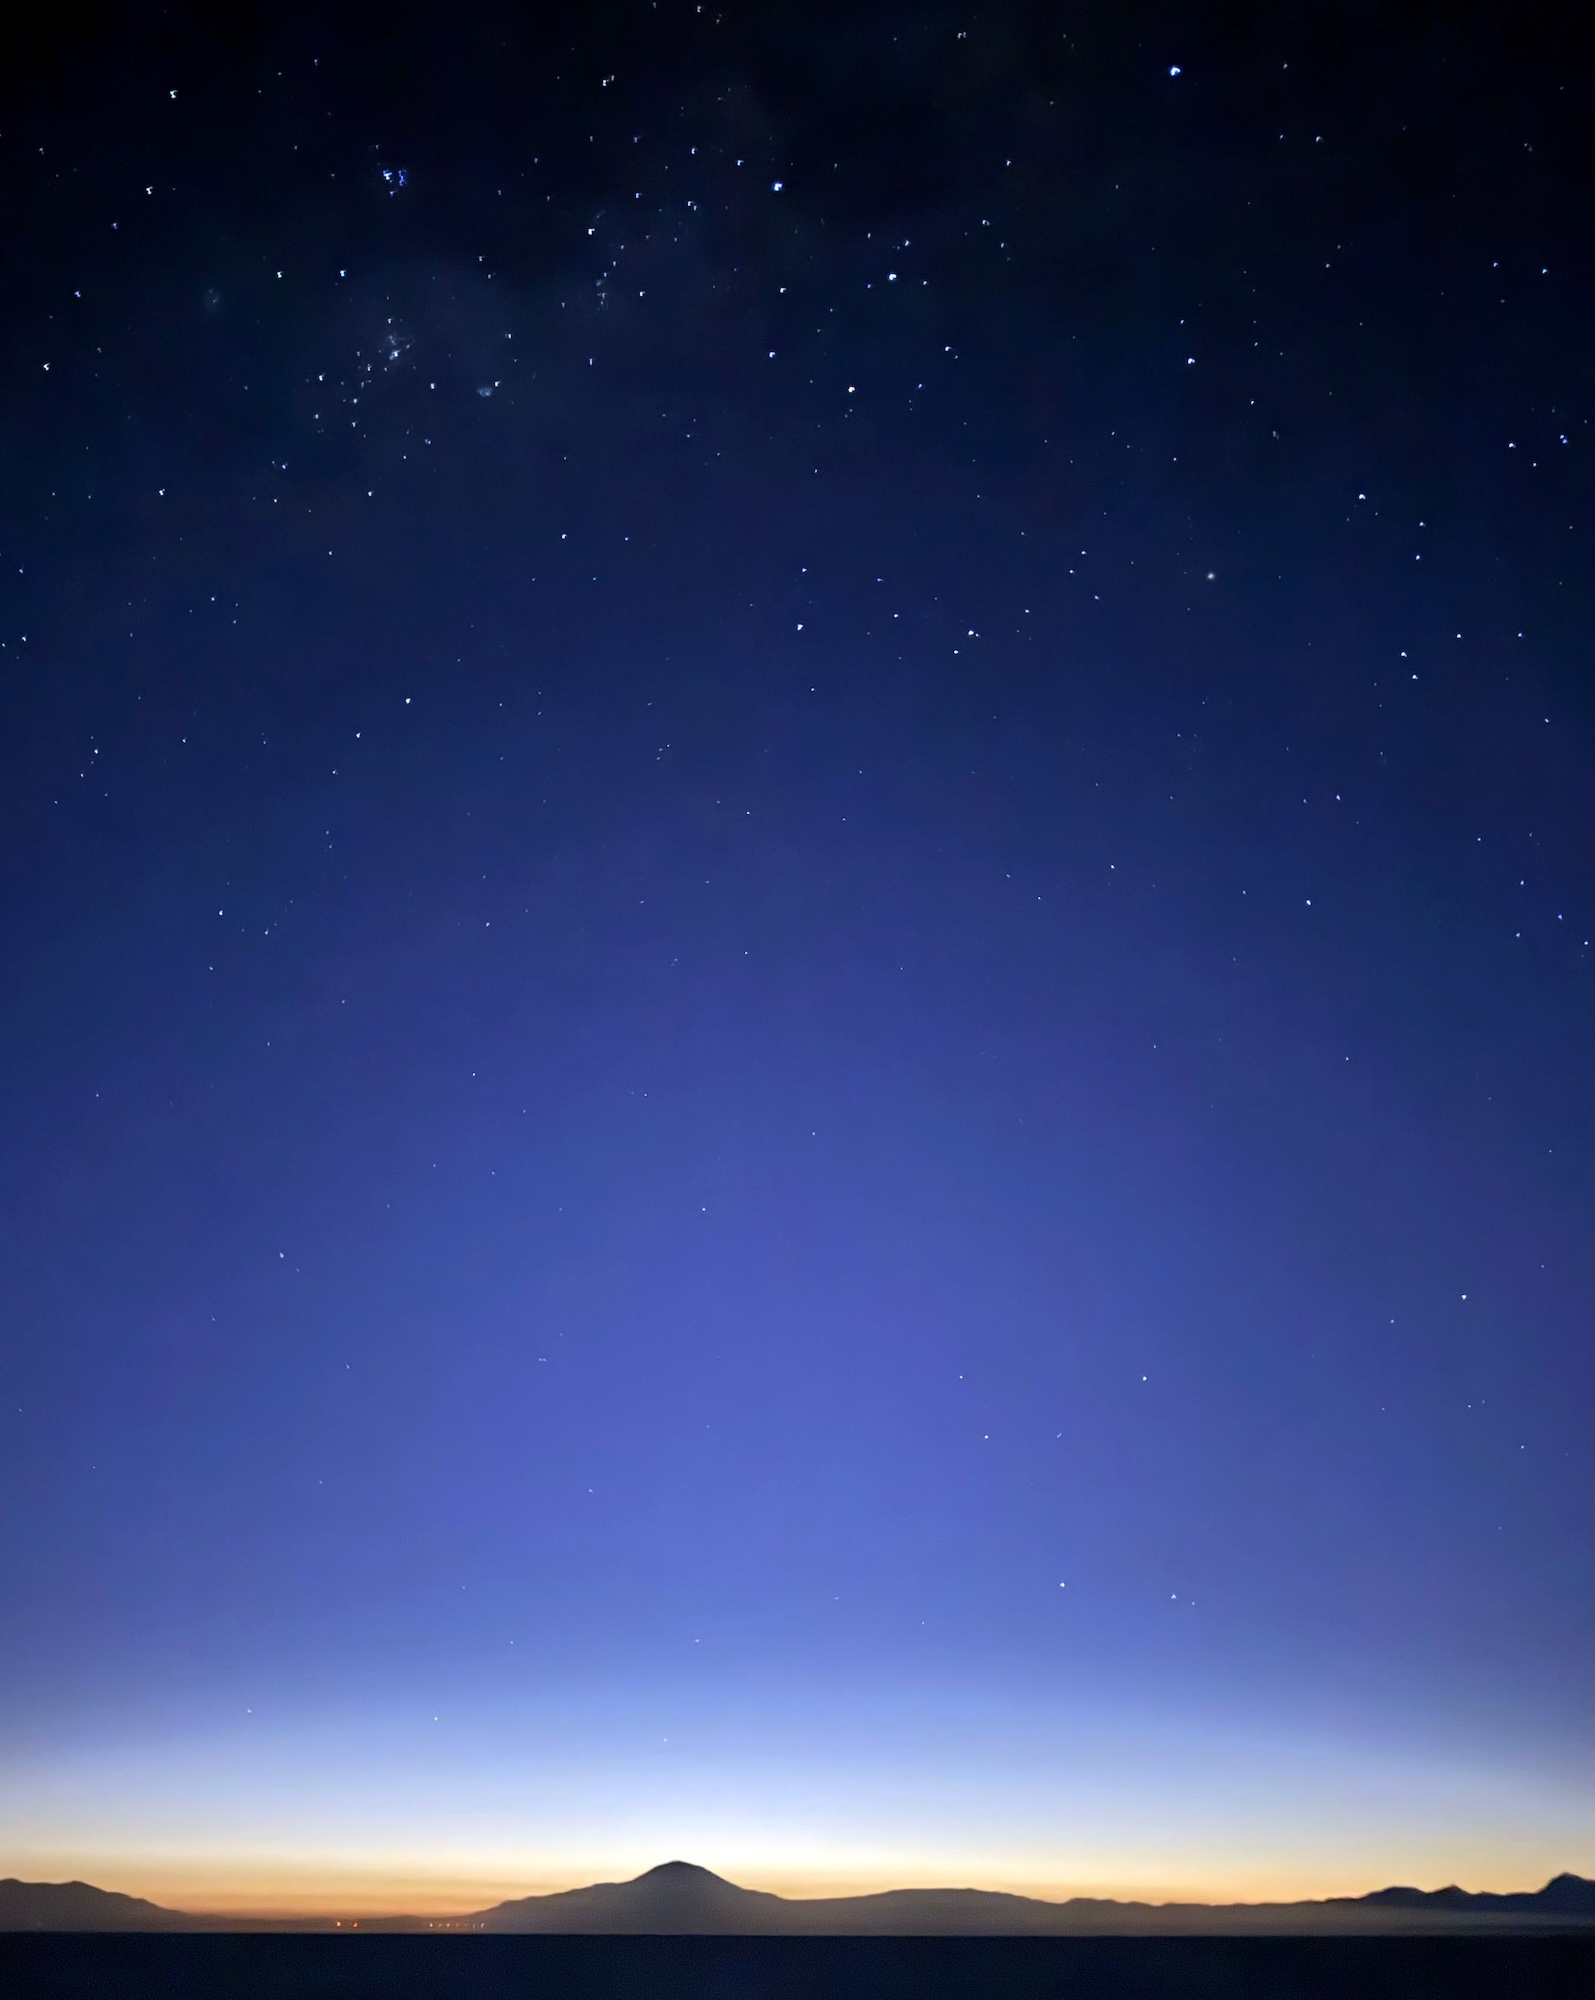
We have attached the drone iMet weather sensors to the side view mirror of a van. In this picture you see two iMet sensors attached to the van mirror. On this day we were comparing the temperature data collected by the two sensors, which were almost identical.Our route for our van temperature measurements takes us over a hill outside of McMurdo Station. Here Kara is driving our van over this hill, with McMurdo behind the van and hill. This photograph is looking the opposite way from the last photograph. Here we see the Ross Ice Shelf extending away to the south (right side of the photograph) and east with the tall peaks of Ross Island to the north. The road we drive on to collect the temperature data is mostly along the ice shelf.In this photograph you can see much of the route we drive each day when we make our temperature measurements. Hut Point Peninsula, where McMurdo is located, is on the right side of this photograph. The Phoenix ice runway is in the direction of Mt. Discovery, the conical mountain on the left edge of this photograph. The clear air of Antarctica makes it hard to estimate distances. Mt. Discovery is more than 40 miles away and the Transantarctic Mountains in the background are more than 60 miles from where this photograph was taken. The patterns in the snow, in the foreground, are created by wind making snow drifts just like small sand dunes.This map plot shows the temperature measured on one of our drives between McMurdo and the Phoenix runway. The colors show temperatures ranging from the -30s F in light blue to near +5 F in dark red. On this day the temperature was relatively warm, between 0 and +5 F as we drove over the hill outside of McMurdo. As we dropped down from the crest of this hill to the edge of the ice shelf the temperature dropped about 20 F as we descended through a strong temperature inversion. Along the ice shelf the temperature ranged from near -30 F, on the stretch of road heading southwest towards Phoenix, to just below 0 F, near the Tall Tower AWS. Another way we can look at the temperature data we are collecting is to plot the temperature versus the distance from McMurdo. This graph shows the temperature measurements between McMurdo (left side of graph) and Phoenix (right side of graph) on three separate days. The red line, showing temperatures on Friday evening September 12th, were the coldest we’ve seen on this trip with temperature at or below -40 deg F for most of the drive. On Monday September 15th (orange line) there was a lot of temperature variability with temperatures varying between -30 and -20 deg F across much of the ice shelf. In contrast, the temperature was relatively mild, in the positive single digits F, on Tuesday September 16th (yellow line).This photograph was taken around 10PM on one of the nights we were making temperature measurements. The horizon never gets completely dark now as the sun is slowly moving towards being above the horizon 24 hours a day, although we can still see some stars overhead including the Southern Cross at the top center of this photograph. The conical mountain in the bottom center of this photograph is Mt. Discovery and the colored lights below and to the left of Mt. Discovery are the runway lights at the Phoenix ice runway.In this photograph another van is passing us as we drive on the snow road heading towards the Phoenix ice runway. The groomed road surface is easily visible under the clear, blue sky on this day. When it is windy blowing snow makes it hard to differentiate the road from the uncompacted snow on either side of the road. In these conditions the flags on the left side of the road are the only way we can stay on the road and not get stuck in the soft snow. Last week winds of more than 20 mph lofted so much snow into the air that at times all we could see were one or two flags along the road – everything else was a featureless white. Those conditions are very disorienting and I am always thankful for the flags at these times.Kara and I at the end of the road at the Phoenix ice runway. This is where we flew into when we arrived in Antarctica 2.5 weeks ago and where we will board our flight back to New Zealand in a couple of weeks.Changing weather from day to day keeps our drive interesting. On this day the recently risen sun, visible through the clouds on the left side of this image, lit the clouds in a beautiful gold color. Our tall tower AWS is on the right side of the photograph and a small hut that we were going to use as our base for our quadcopter drone flights, is on the left side of the photograph.On this day a chaotic sky of clouds float above Hut Point Peninsula (center) and Mt. Erebus (right). Mt. Erebus is the Earth’s southernmost active volcano and in this photograph you can see a little bit of steam rising from the summit of the volcano. Strong winds blowing from left to right across Hut Point Peninsula were causing blow snow along the ridge of the peninsula while the wind near Phoenix, where we took this picture, was completely calm. On our drive back, as we passed from the calm to strong winds, we saw a snow dust devil spinning across the ice shelf.On completely overcast days our view reduces to a monotone of shades of gray. Here the only thing that is visible is the dark rock of Hut Point Peninsula.While on other days clear skies and a rising sun light the snow and ice in a warm, golden light. Steam rising from the summit of Mt. Erebus is visible on the far right edge of this photograph.I’ll end this post with a photograph of Mt. Discovery at sunrise as seen from our office window in McMurdo. I feel so fortunate that I get to work in a place as beautiful as Antarctica and watch the ever changing light and clouds each day.
Thanks for reading.
5 comments on “Fieldwork”
Thanks for the update, it looks like you’re staying very busy! The pictures are great! Stay safe
adaption of measurements in the face of failed logistics is the fact of life of remote field research! Great post. Pictures of near ice surface mirages and air turbulence brings back memories from my time on/near Baffin Island.
Wow, it’s amazing to read about the challenges you’ve faced in Antarctica! Even without the drones, it’s inspiring how you and Kara have adapted to continue your research. The dedication to studying the atmospheric boundary layer in such extreme conditions is truly impressive. Wishing you both safe flights and successful work in the remaining weeks!
Very interesting post, John! I was wondering how you know where to drive without any sign posts or roads. Love seeing the active volcano and hearing about the science too. Save travels back!


Thanks for the update, it looks like you’re staying very busy! The pictures are great! Stay safe
adaption of measurements in the face of failed logistics is the fact of life of remote field research! Great post. Pictures of near ice surface mirages and air turbulence brings back memories from my time on/near Baffin Island.
As always John, enjoying your pictures and find your explanations as you go along so interesting. Enjoy
Wow, it’s amazing to read about the challenges you’ve faced in Antarctica! Even without the drones, it’s inspiring how you and Kara have adapted to continue your research. The dedication to studying the atmospheric boundary layer in such extreme conditions is truly impressive. Wishing you both safe flights and successful work in the remaining weeks!
Very interesting post, John! I was wondering how you know where to drive without any sign posts or roads. Love seeing the active volcano and hearing about the science too. Save travels back!