
 Just Updated
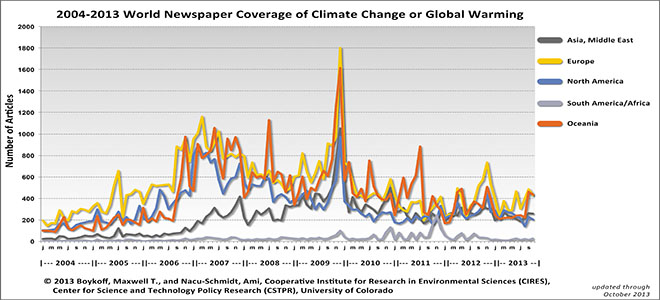
Media & Climate Change Figures:
World, Australia, Canada, India, New Zealand, UK, & US
Updated through October 2013
Max Boykoff and Maria Mansfield first assembled this figure while conducting research at the University of Oxford, Environmental Change Institute. Boykoff is now here at the University of Colorado-Boulder, and Mansfield is at Exeter University in the UK. They continue to update this figure on a monthly basis as a resource for journalists, researchers, and others who may be interested in tracking these trends. The chart above contains data through the end of the previous month.
This figure was first presented at a side-event at the UN Conference of Parties 14 (COP14) in Poznan, Poland for a panel entitled ‘Overcoming the communication deficit: encouraging climate change debate in the Global South’. This 5 December 2008 panel was sponsored by PANOS and the International Institute for Environment and Development (IIED).
Boykoff and Mansfield assembled the data set through three main search engines – Lexis Nexis, Factiva, and ABI/Inform. The Boolean string used was ‘climate change OR global warming’, and the tracking of month-by-month trends began in January 2004. This starting point was due in part to data availability, where a number of these newspaper archives are only available from that point forward.
Due to sampling, the relative trends across regions are more useful than absolute numbers in the figure. Overall, Boykoff and Mansfield sought to include newspapers that were influential – in circulation and influence on policy/public opinion – as well as geographically diverse. Read more …